| |
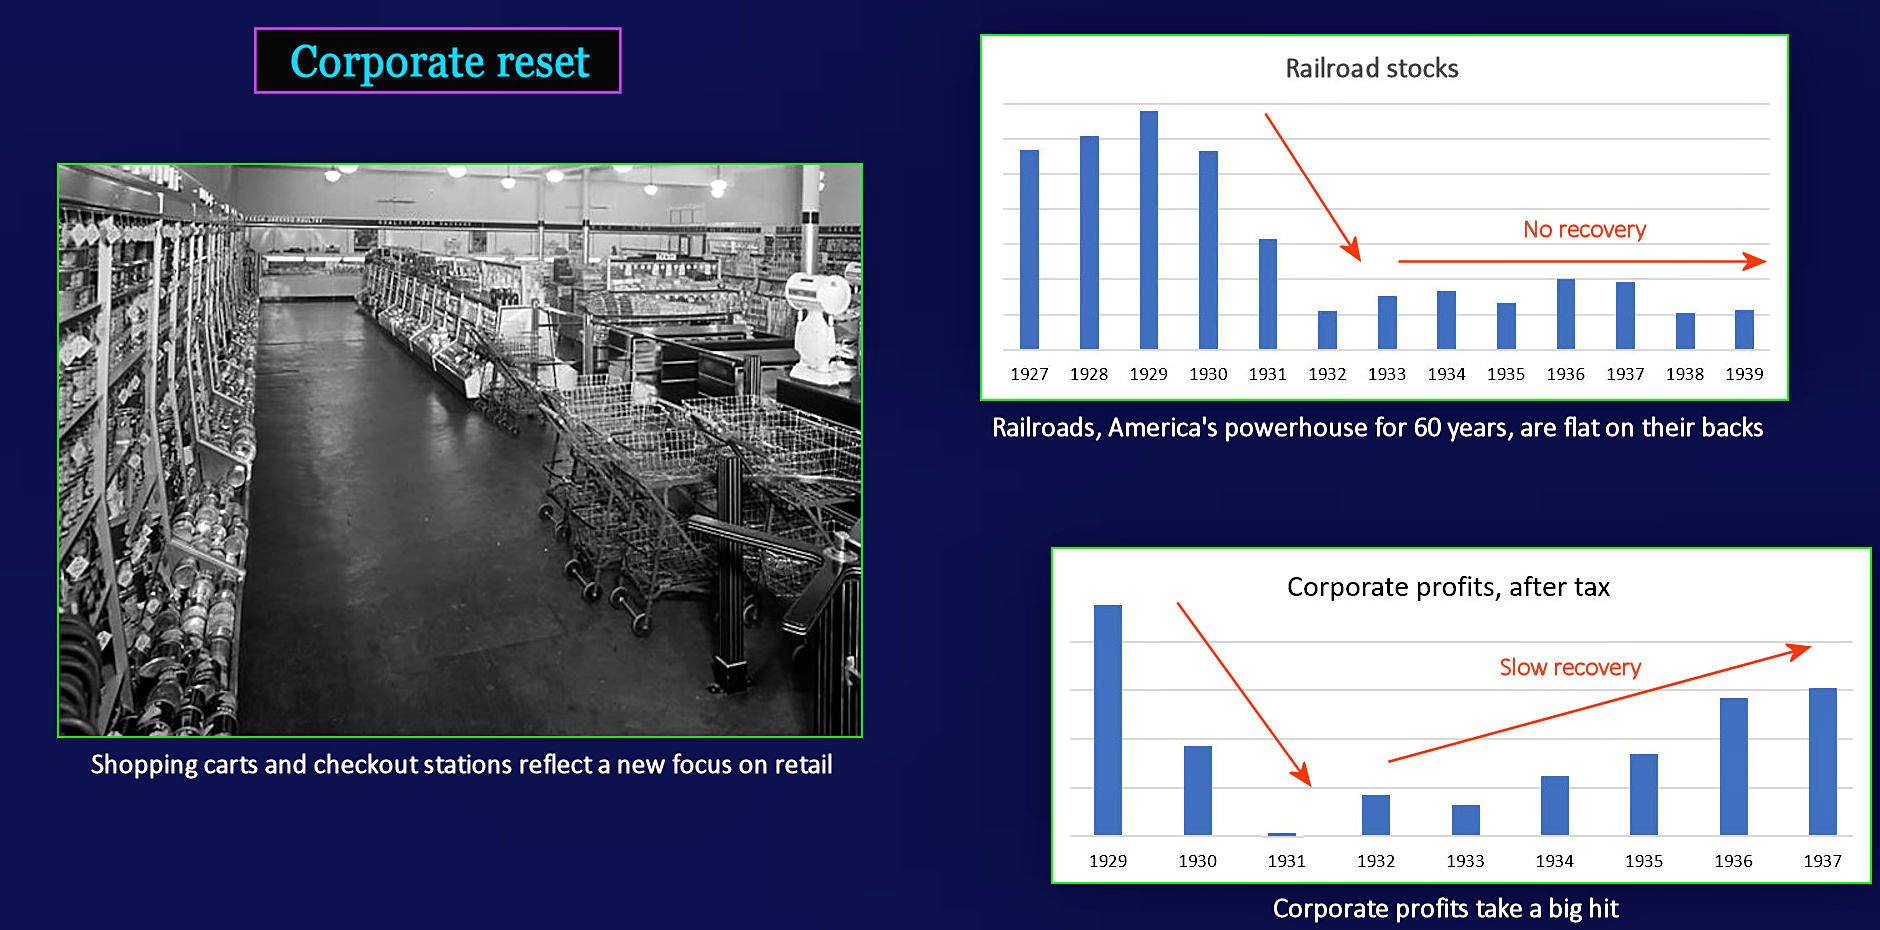
New Focus on Customers The charts above illustrate the problems facing business. Most serious is the flat-lining of railroads (top right), which hurts steel first, and then manufacturing in general. The first reaction is to let workers go. After that, companies sacrifice profits, resulting in prolonged weakness (lower right). The continuing high rate of unemployment reflects the reluctance of businesses to hire workers back, as the economy improves. One approach to reviving sales is to introduce handy new shopping carts, which beg to be filled (top left). |
| |||||||||
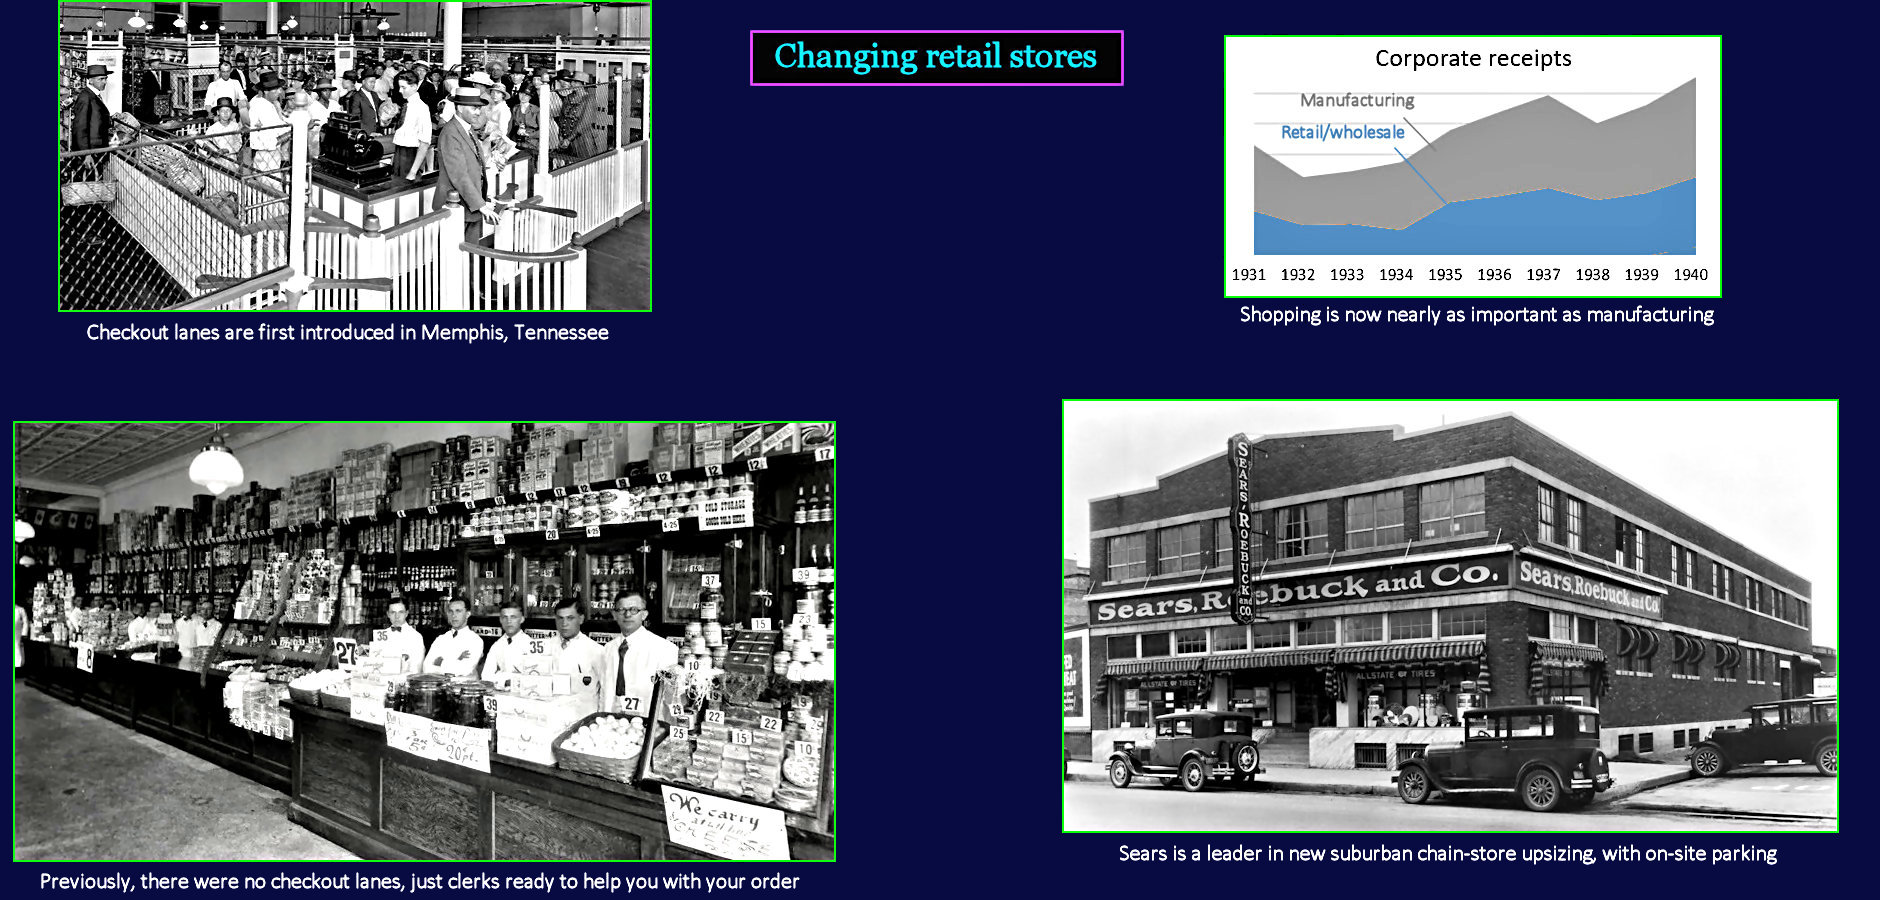
Easier Shopping Manufacturing companies make products, but usually don't sell them directly to customers. Instead, they sell to wholesalers, who buy products from many different manufacturers in large quantities, and resell them to retailers. Some may also sell directly to retailers themselves, like the big department stores, where customers actually do much of their shopping. The chart indicates that companies dedicated simply to selling products (wholesalers and retailers) are soaking up a large percentage of total corporate receipts. There are plenty of independent retailers, of course, but many stores are now part of a chain of stores under a single brand, like Sears. Chains might have hundreds of individual retail stores, all similar in appearance and layout. | |||||||||
| |||||||||
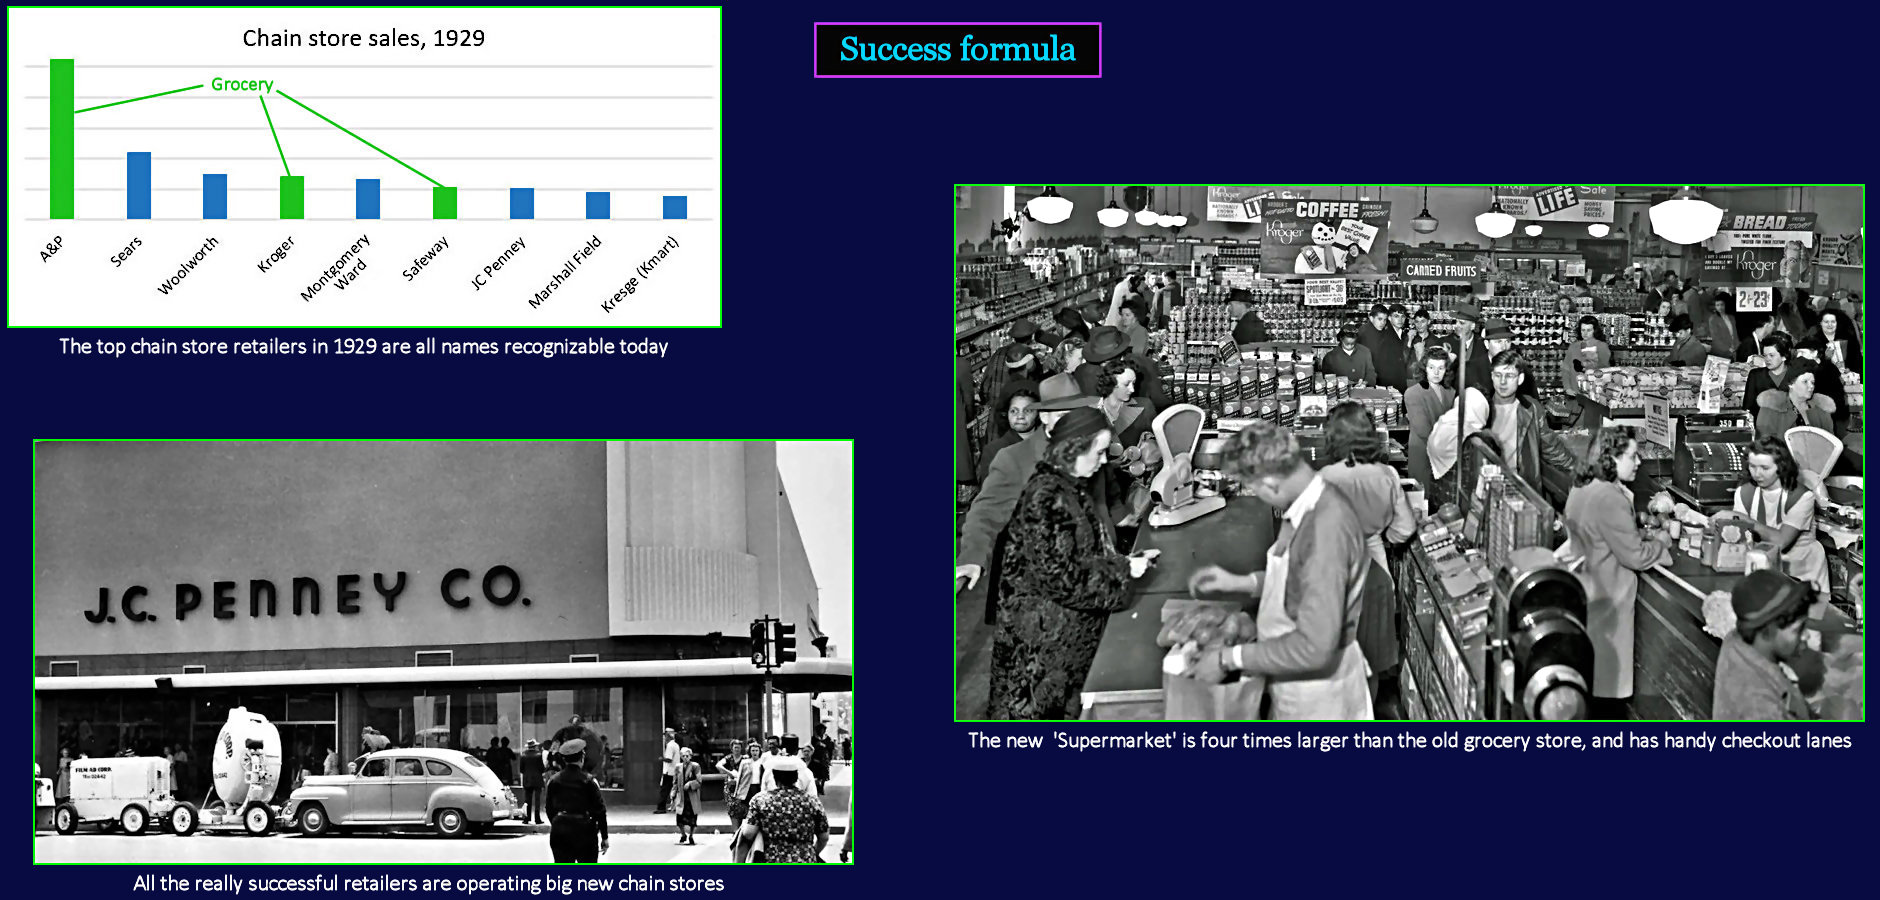
Mass Retail The beauty of chain stores is simplicity. Once you work out a successful formula for products and floor space, you can replicate it thousands of times, in thousands of locations. The important thing is having the right formula. The chart shows that the dominant chain store is the grocer A&P. By a mile. The A&P formula involves severe cost-cutting, with most of its early stores having only one or two employees. This works so well that it goes from 600 stores in 1913, to 4,500 just seven years later. By 1930, A&P is opening one new store every day, serving a total of 15,000 locations. During the 1930s, however, it begins closing half these stores, replacing them with 1,100 upsized new 'supermarkets,' Sales increase by 50%. | |||||||||

| |||||||||
Entertainers Join the Mix With so much energy being channeled into selling, rather than producing, advertising is becoming more important. It's much easier to sell a product that's already familiar to customers, and new concepts are being explored to gain attention. Judy Garland bursts into stardom in 1939, with the blockbuster hit The Wizard of Oz. That same year, she appears on the cover of a popular women's magazine (left). Ads are also focusing more on branding, and less on product features (center). Meanwhile, radio brings something entirely new to the table. Advertisements that you can't escape. You have to listen to the entire commercial before the program resumes. Unlike later canned TV commercials, these radio spots are performed 'live.' | |||||||||
| |||||||||
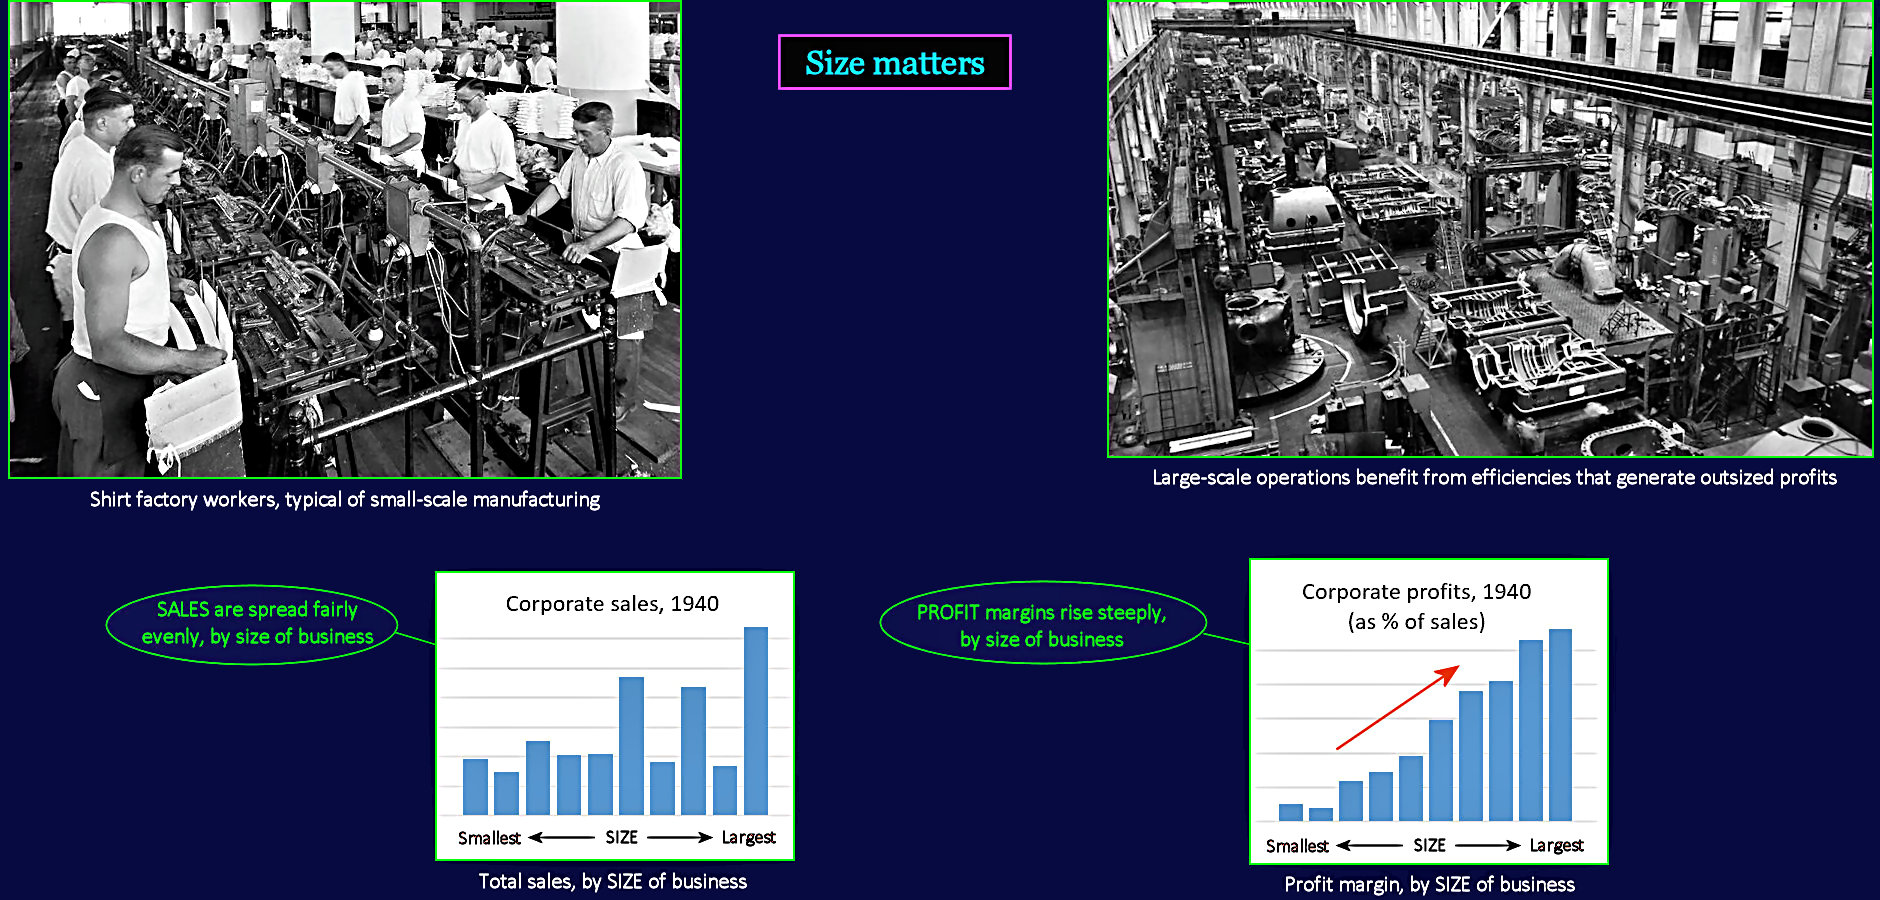
Bigger is Better Through it all, the rate of corporate bankruptcy barely rises at all during the Depression. This is due largely to the ability to shed workers, as orders decline, but another factor is the unstoppable trend towards bigness. The larger the company, the more effort can be focused on improving efficiency. The two charts above divide the corporate world into 10 segments, by size. In each chart, the blue bars at the left represent the smallest companies, while those at the right are the giants. The left-hand chart shows that revenues are fairly evenly distributed, though skewed towards bigness. The right-hand chart shows that profitability rises in a straight line. Profits for the smallest are nearly zero, while those of the largest average 11%. | |||||||||
| |||||||||
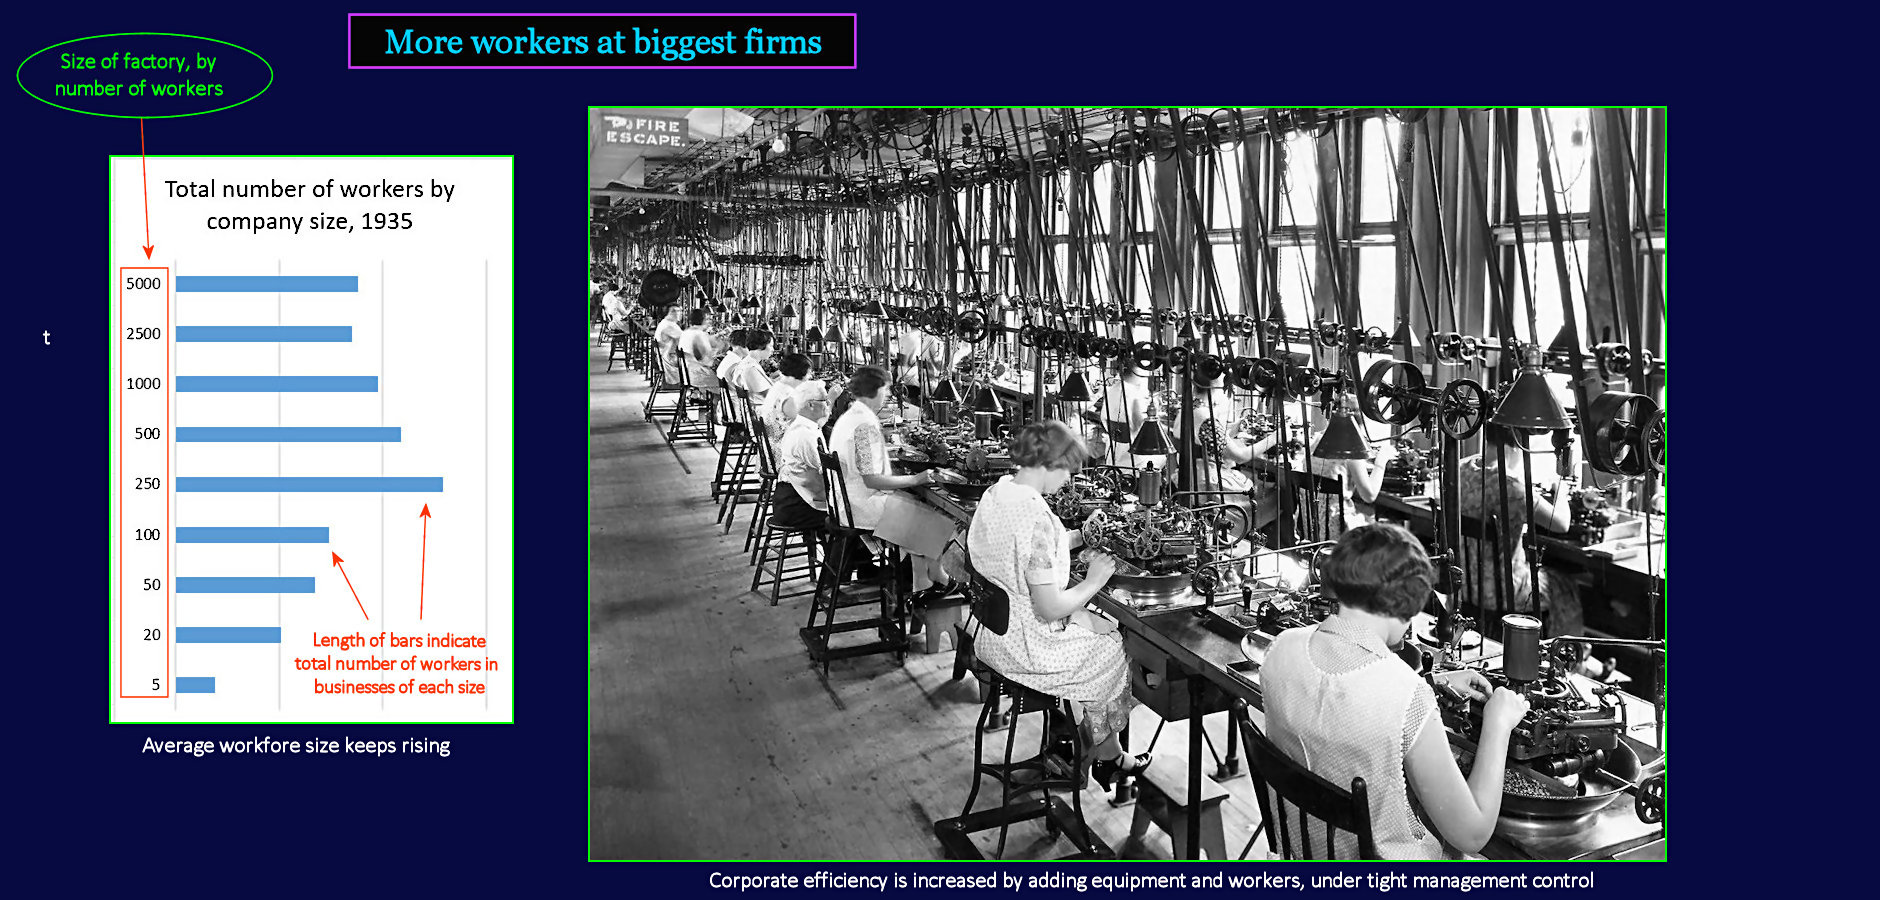
Upsizing Factories The trend, clearly, is towards bigness. The chart above divides the total corporate workforce into separate groupings by the number of workers in each factory, this time arranged vertically. The largest are at the top, and smallest at the bottom. The length of the blue bars indicates the total number of workers employed by companies whose maximum number of workers is listed at the left. About half of all workers are employed in companies with more than 250 workers. Efficiency experts arrange equipment so that each worker has everything within easy reach. As in the auto business, workers repeat the same few operations all day. Because it isn't a moving line, however, employees can work at their own pace. | |||||||||