| |
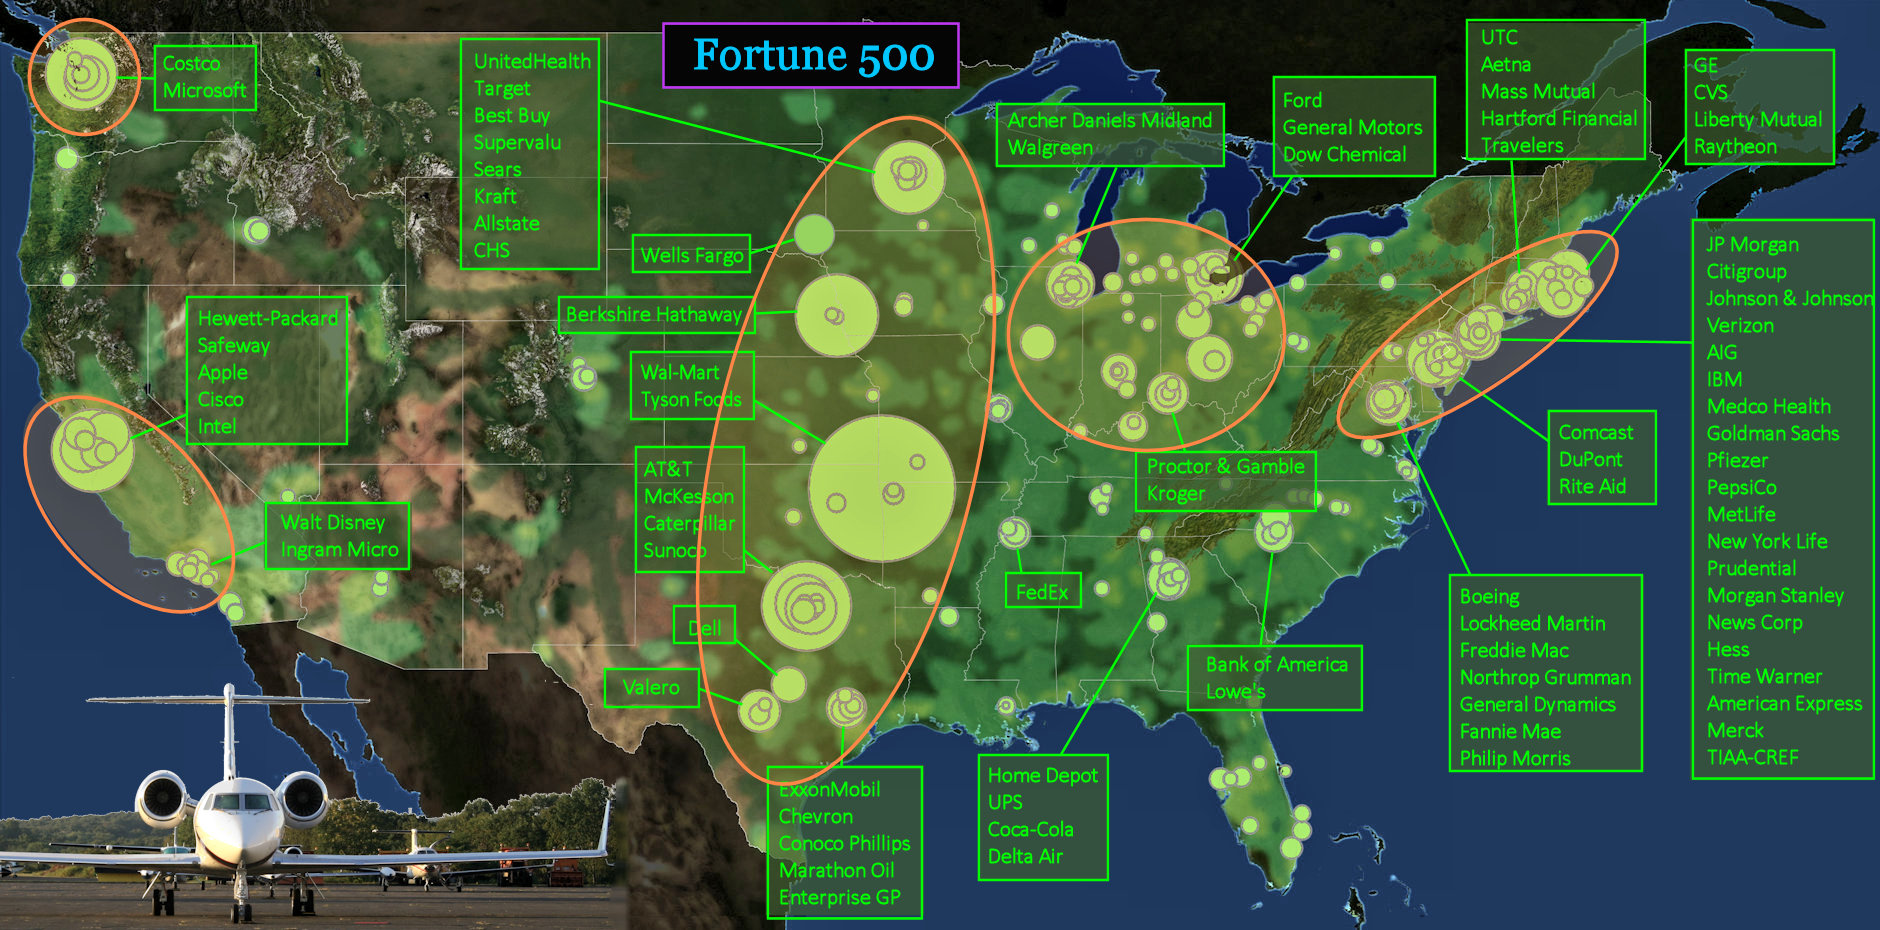
Profit Extraction Centers The map above shows the location of Fortune 500 corporations in America in 2010. The size of the green circles is proportional to the clout of the corporation, as measured by annual revenue. Giant firms are concentrated in a dozen or so major cities (inside ORANGE ovals). Most are on the East Coast, but the largest individual players are located in the middle of the country, and on the tech-heavy Pacific Coast. |
| |||||||||
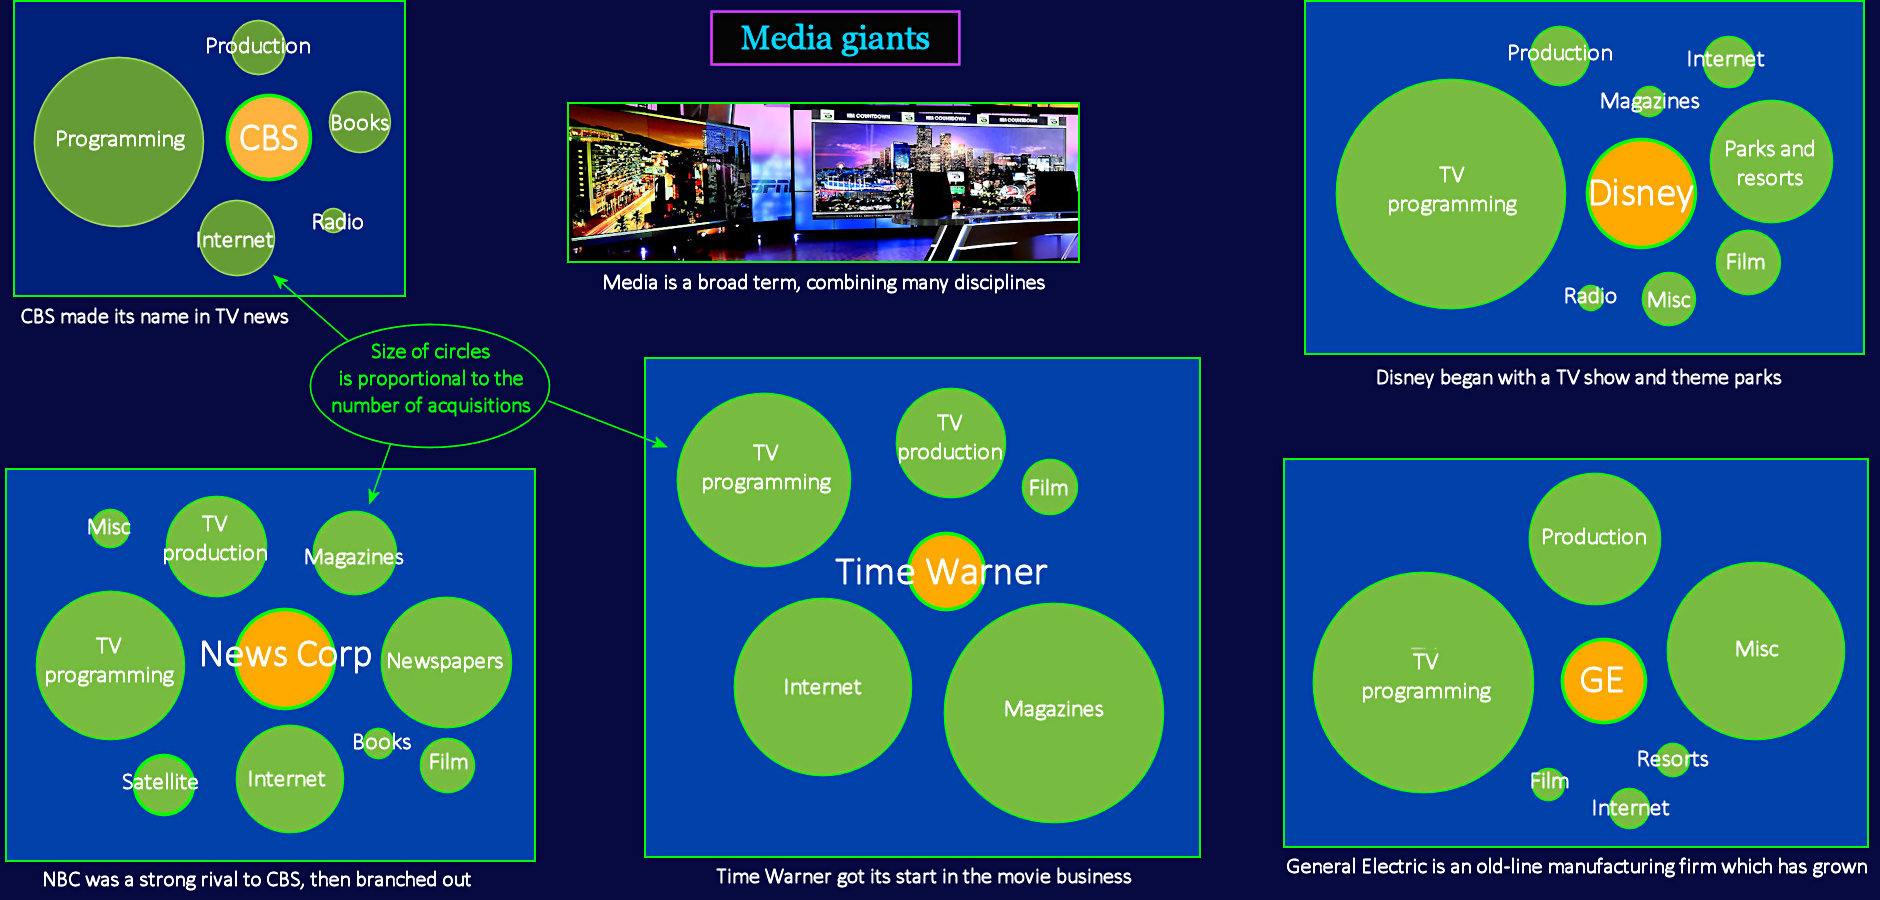
Corporate Sprawl To trace back America's love affair with bigness, we can start with the major railroads, which grow large by acquiring control of other railroads. This might be considered normal, organic growth. Later heavyweights are manufacturing giants, like Carnegie Steel and Ford Motors. The biggest firms normally dominate their industries, and the natural tendency to acquire rivals turns into the desire to acquire almost anything of value. If you are experienced in manufacturing cars, for instance, you will probably be good at managing any complex business. When the internet arrives, media giants emerge by acquiring anything related to entertainment. This starts with radio and TV, but grows to include movies, magazine, resorts and anything that can be streamed. | |||||||||
| |||||||||
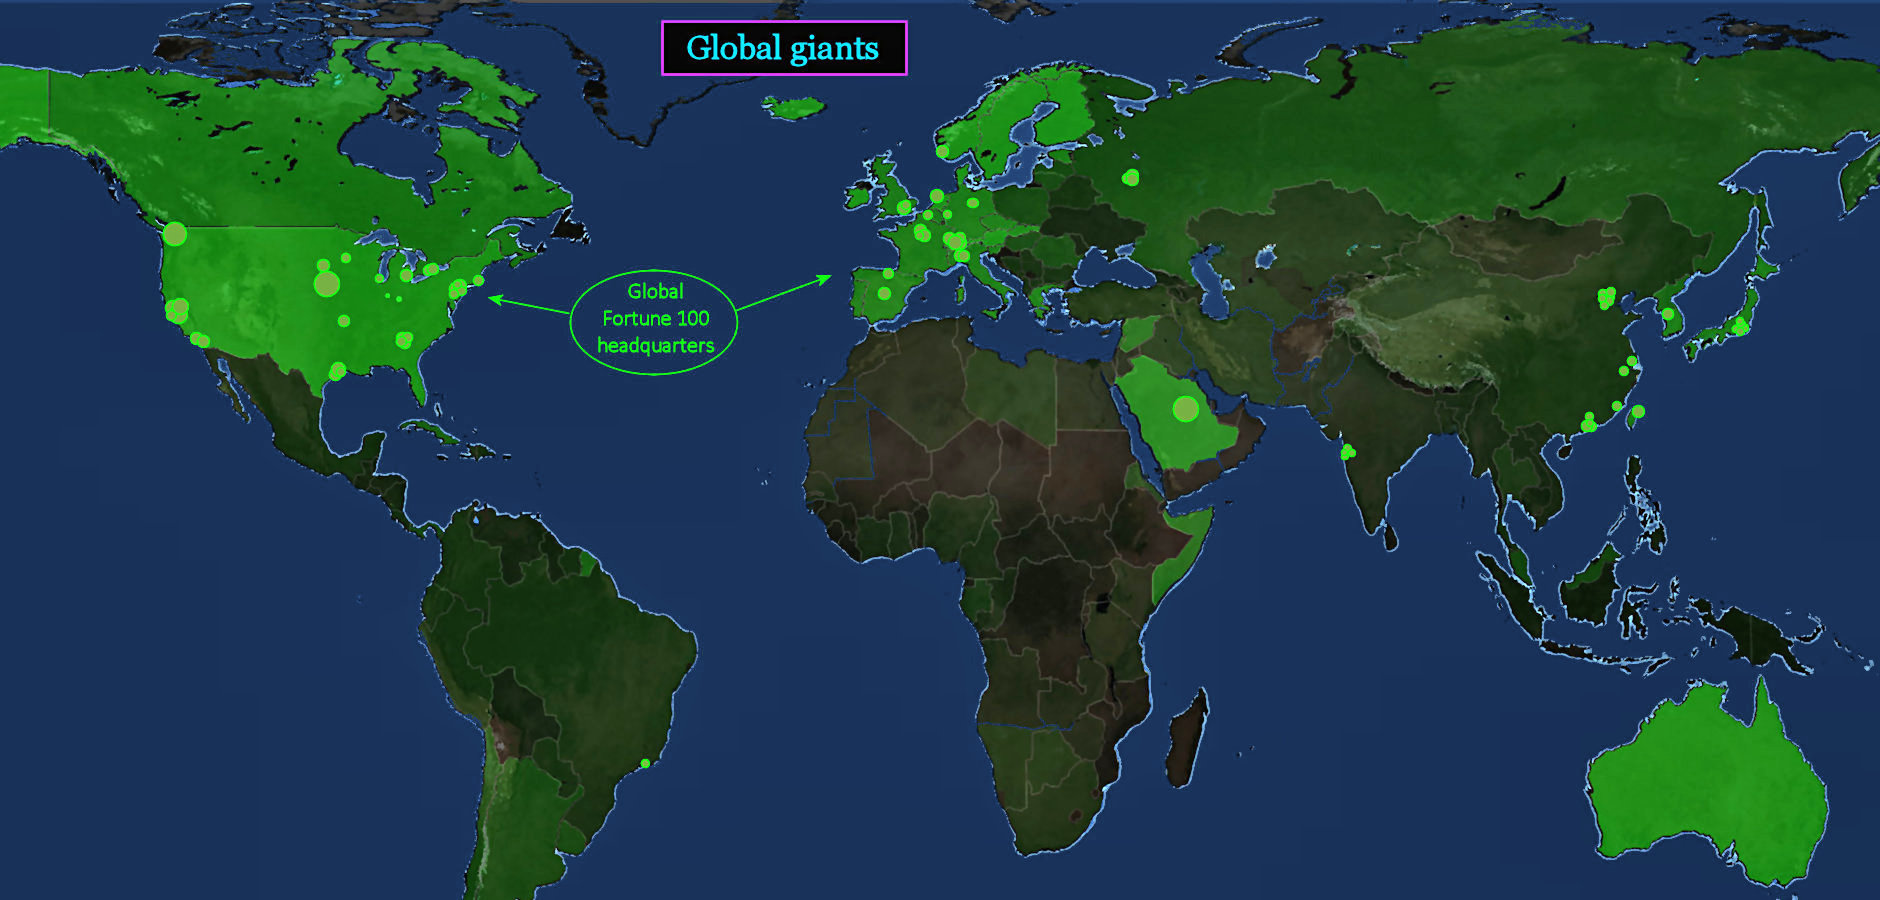
Global Competition The circles on the map above indicate profits (not revenue) of the world's 100 largest corporate giants in 2010, which again are clustered in just a few cities. It reveals that, although American GDP is roughly equal to that of China (and to that of Europe taken as a whole), America's share of yearly corporate profits nearly equals that of the entire rest of the world, combined. While America has lost most of its industrial capacity, it excels at controlling the flow of wealth. Increasingly, this is due to the astonishing profitability of social media and cloud computing companies, like Amazon, Apple, Google and Microsoft. Measured by sales (not profits) Walmart is the world's leading corporation. | |||||||||
| |||||||||
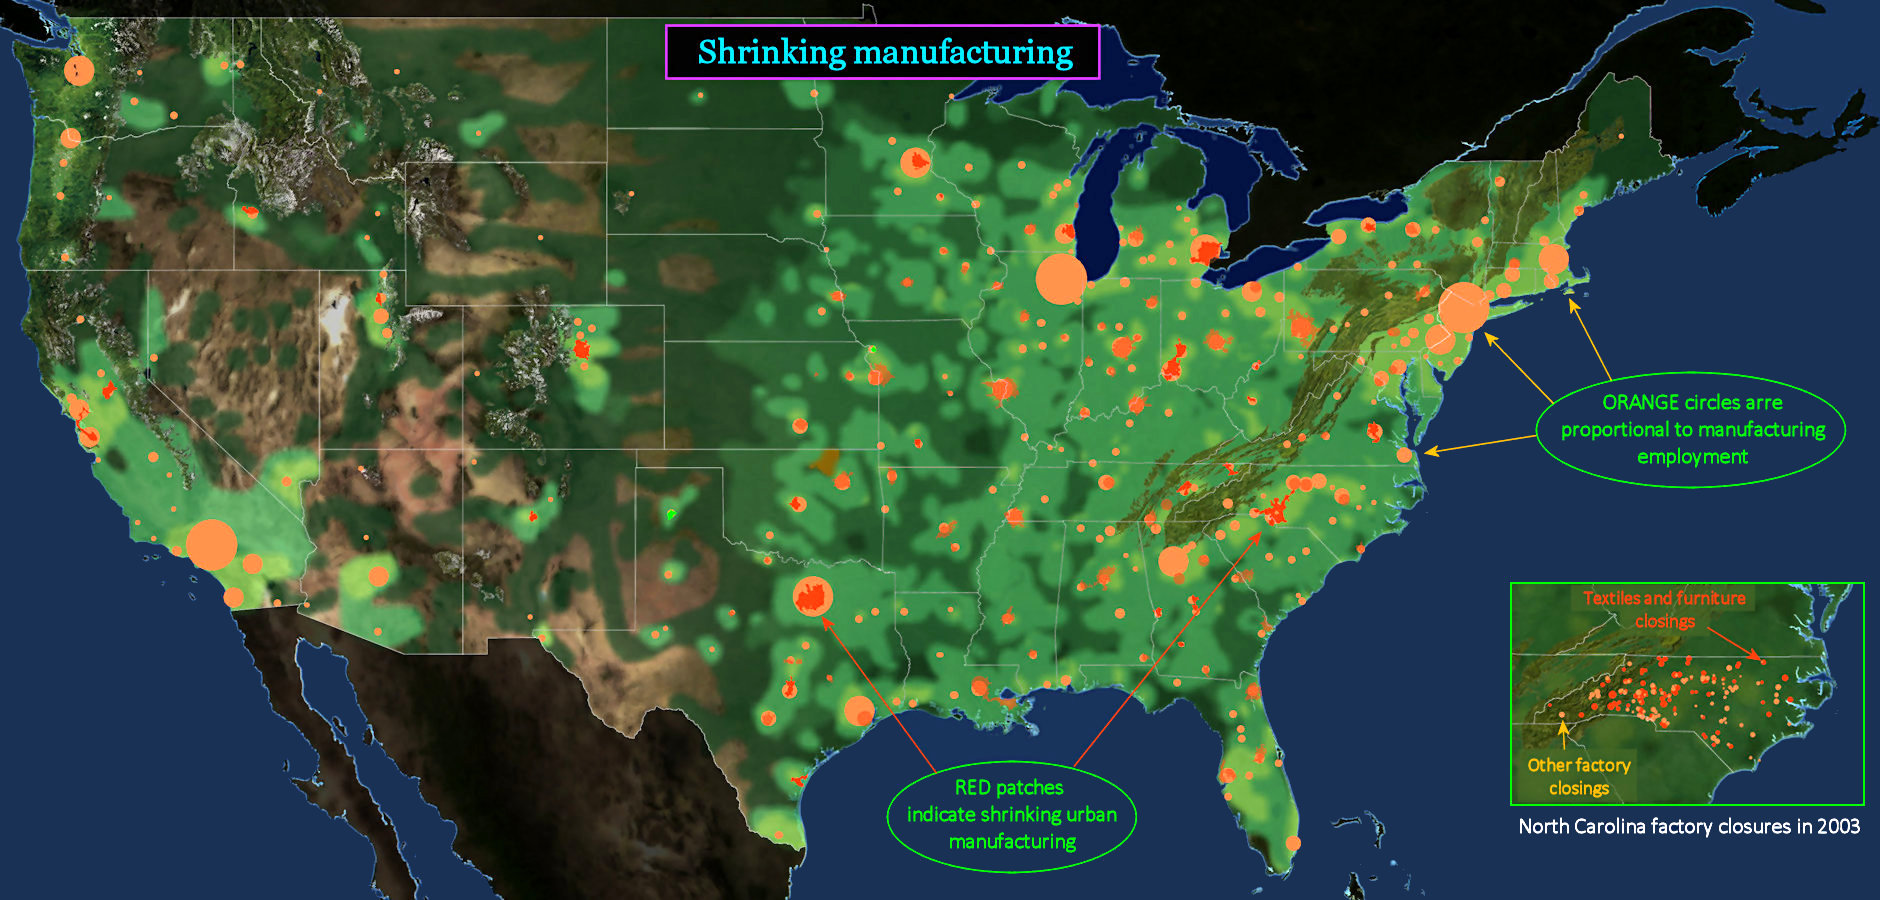
Offshoring This map indicates that there are still plenty of things being made in America, despite the 'offshoring' of most heavy industry to Asian countries, where labor costs are much lower. Manufacturing sites that remain have mostly moved out of the city, and into suburban industrial parks, where land is less expensive. RED patches on the map indicate urban areas that lost manufacturing jobs during the preceding decade, in a process likely to continue. | |||||||||
| |||||||||
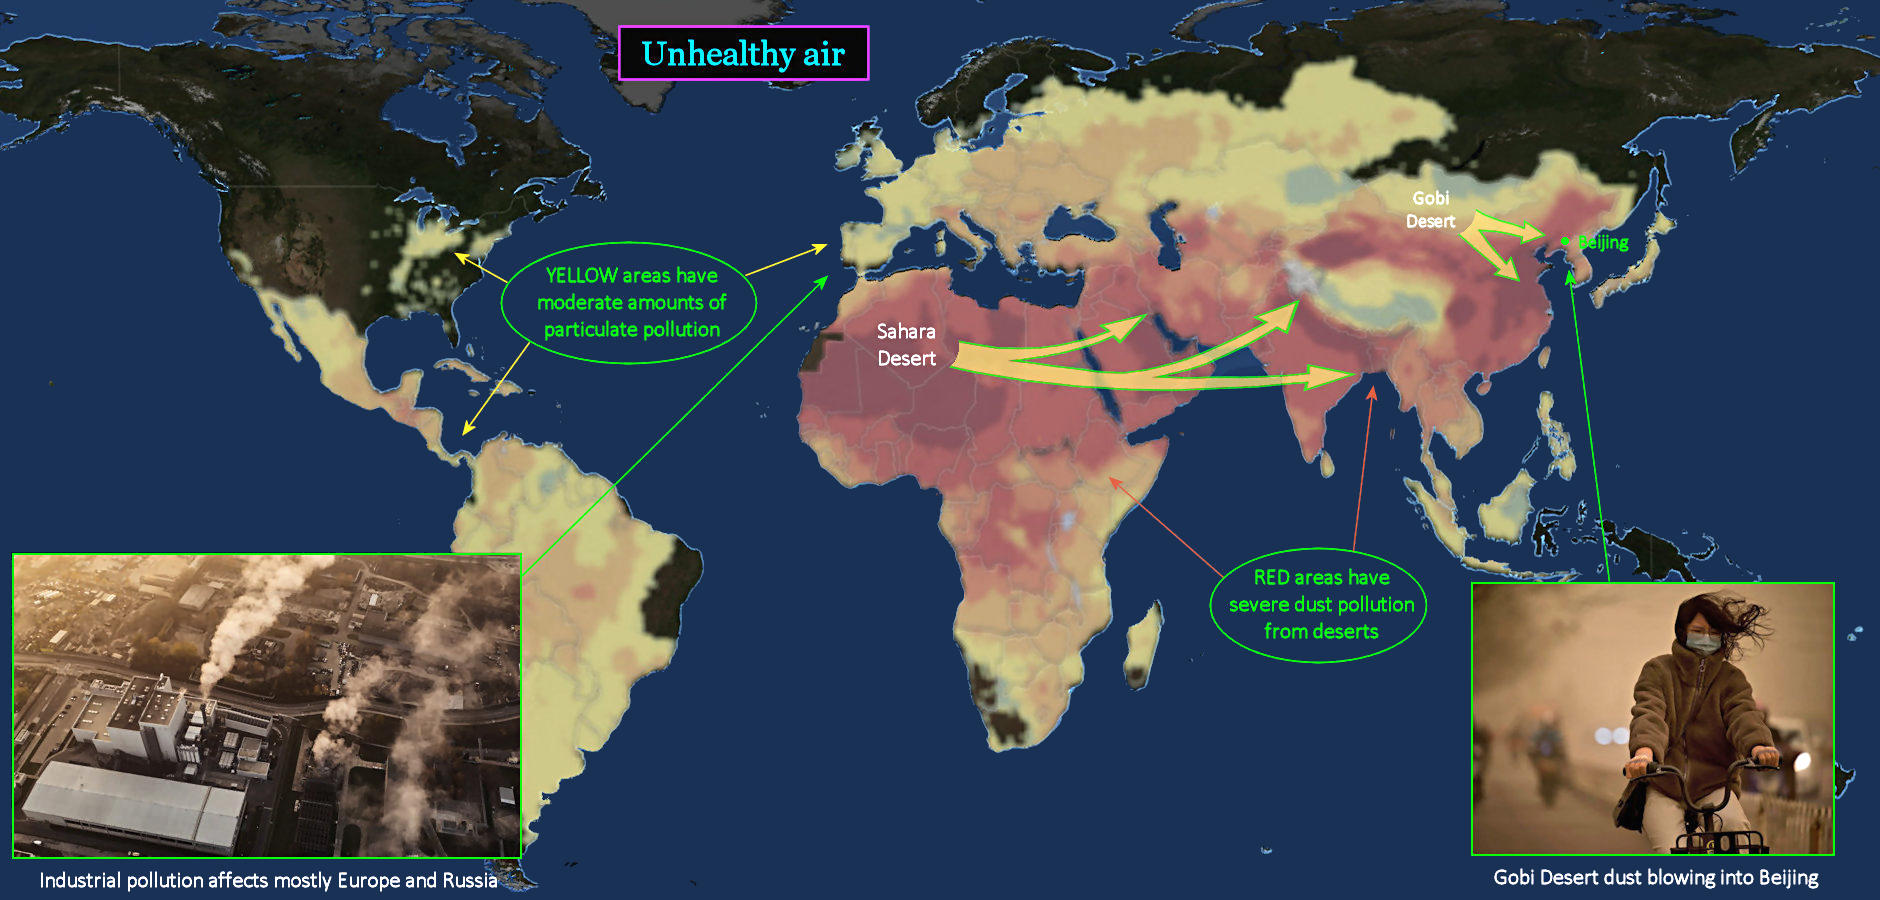
Asthma Sources The highlighted areas above have the worst air quality, as measured by the number of small particles in the air. These are a mixture of dust and industrial pollution, which gradually drifts east with the prevailing winds. Surprisingly, America is one of the few places on earth where particle pollution has decreased in recent years. This is partly due to regulations limiting industrial pollution, and partly because winds coming in off the Pacific are relatively dust-free. | |||||||||
| |||||||||
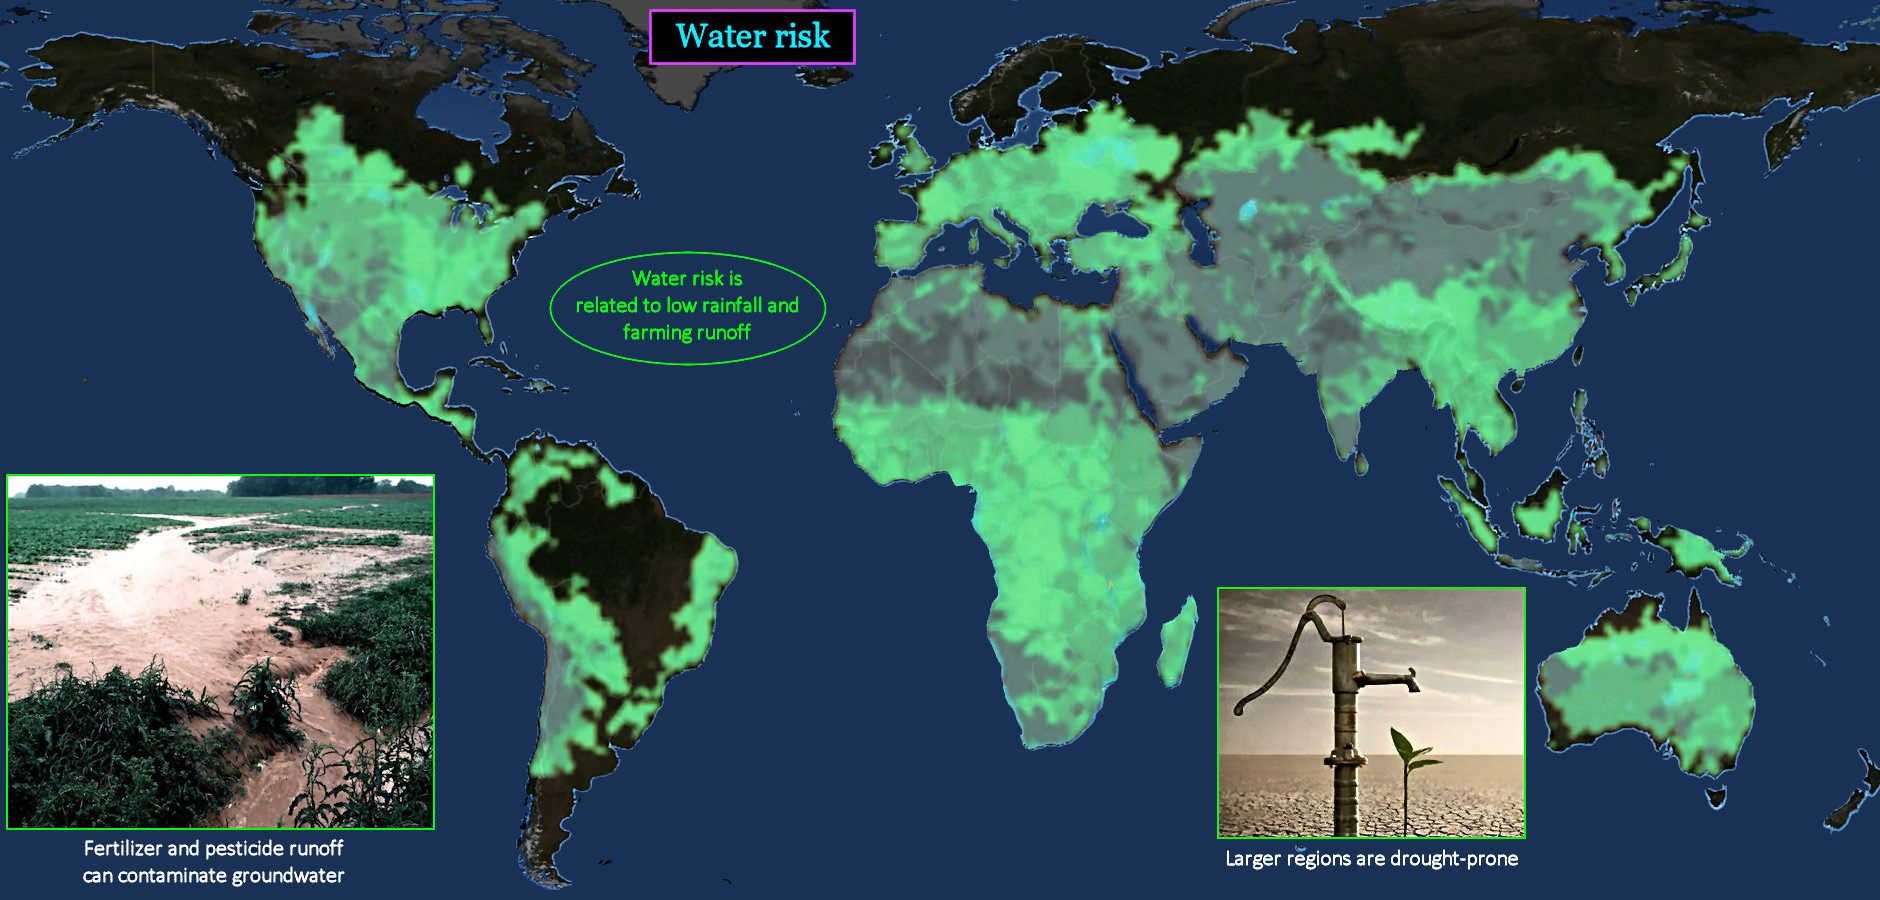
Drinking Issues Water-quality issues are mostly related to the likelihood of future drought. In the US, this is especially true in the drought-prone West, where conditions that favor the spread of forest and brush fires have recently grown much worse. Additionally, Midwestern aquifers are being seriously depleted, which will reduce the ability to irrigate dry areas. Pesticide and fertilizer runoff into the groundwater also pose a growing risk. | |||||||||