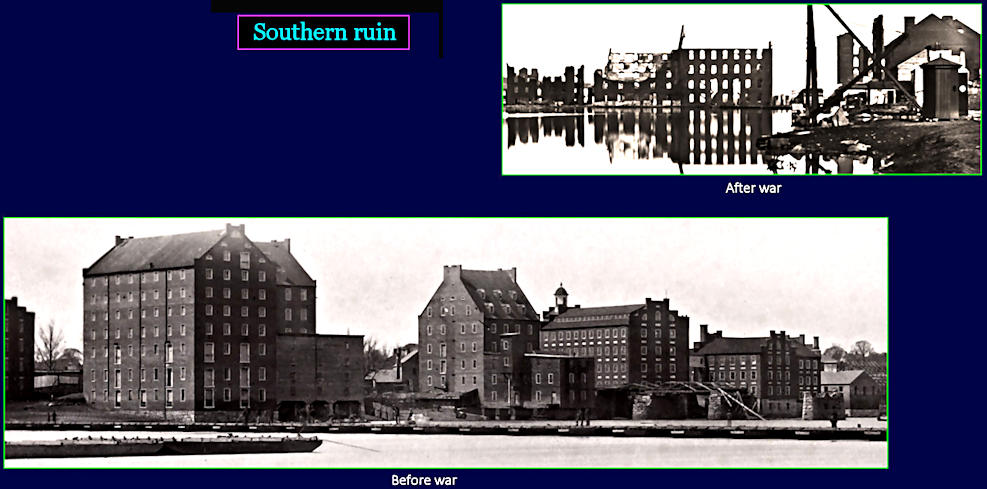
Permanently Stunted?It's hard to overstate the devastation that war has brought to the South. Nearly a quarter of military-age men are gone, and nearly half the livestock. The railroads are in ruin, and three of the five largest cities have burned. The fact that two of the three (Richmond and Charleston) were actually torched by fleeing Rebels makes little difference. Before the war, half of southern wealth was invested in slaves. All this is now gone. Southern plantation owners are left dazed and confused. Without free slave labor, plantations can't turn a profit. And without profits from cotton, it will take the South 100 years to recover from the war. |
| ||||||||||||||||
| |||||||||
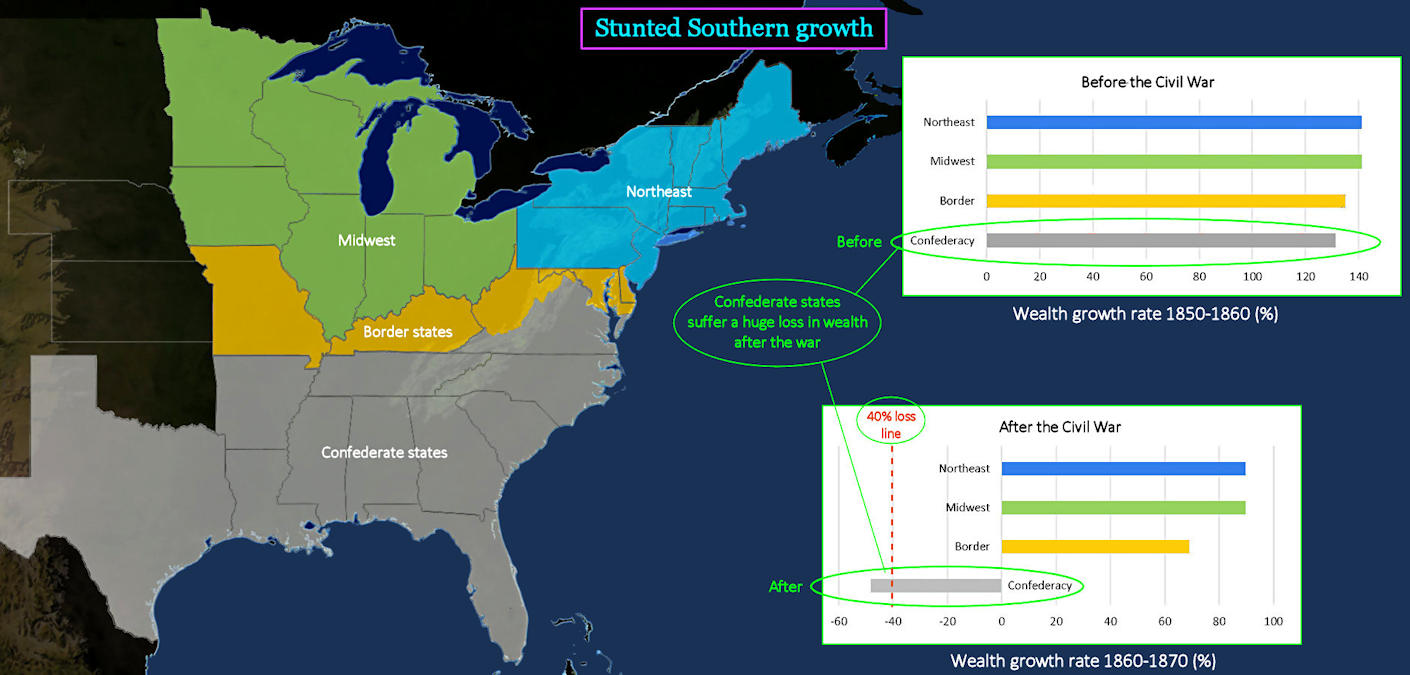
Whacked The two charts above illustrate just how badly the South is beaten up by the war. Both charts show growth rates for wealth (property and land) in the four regions shown on the map. The upper chart is the pre-war period. It compares the growth rate for years between 1850 and 1860. Somewhat surprisingly, all four regions are growing at almost exactly the same rate, averaging 130%. Wealth has more than doubled in these 10 years, everywhere. The lower chart shows the growth rate for the following ten years, including all the war years. Except in former Confederate states, growth rates are somewhat reduced because of war losses, averaging 80%. But in the South, wealth has been cut in half, due largely to the uncompensated loss of its slaves. | |||||||||
| |||||||||
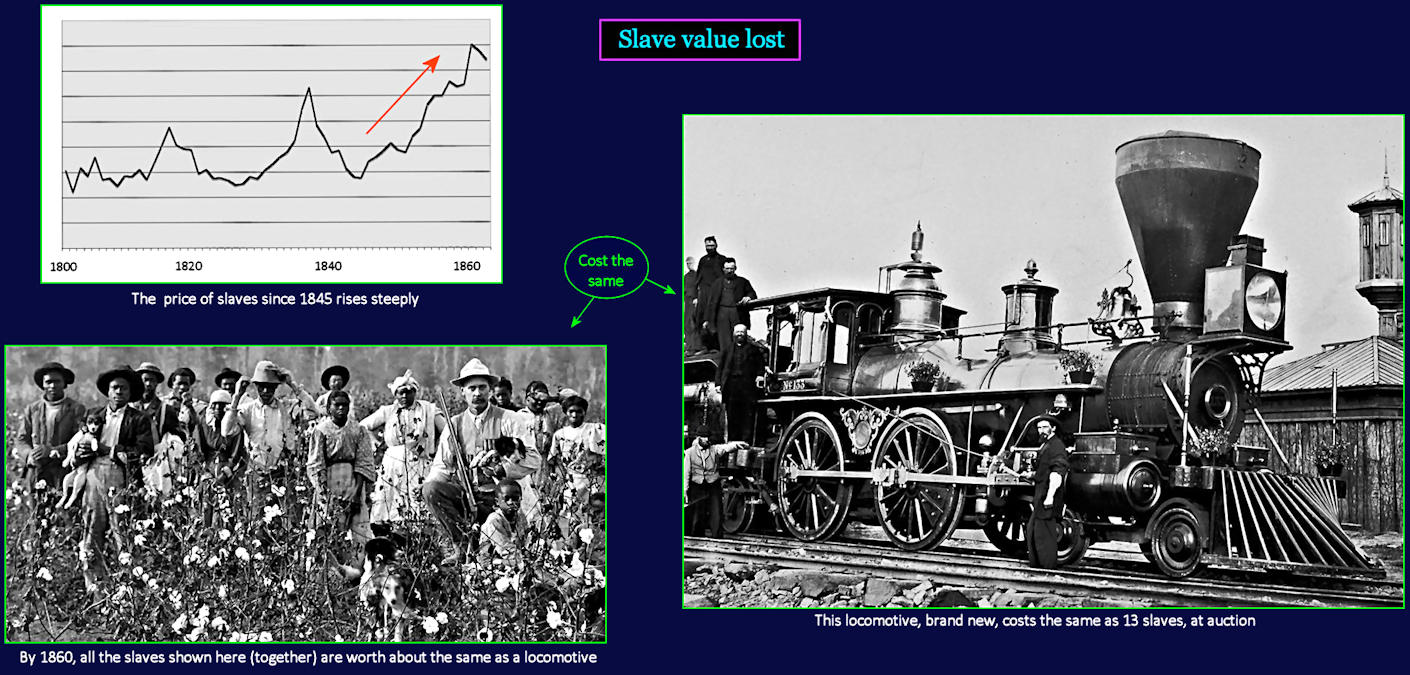
Valuable Assets To understand just how devastating the loss of slaves is for plantation owners in the South, it is important to realize just how valuable slaves have become by 1860. Increasing demand for cotton has driven up slave prices since 1850 (see chart above), so that 13 slaves now cost about as much as an entire steam locomotive. While most southern families own no slaves at all, about 10% own more than six. Almost a quarter of all slaves work on plantations, with the typical cotton plantation owning between 20 and 30 slaves. This is equivalent to the value of two locomotives. The largest 1% of plantations own slaves with a value equivalent to at least 10 locomotives. This value is all lost when the slaves are freed. | |||||||||
| |||||||||
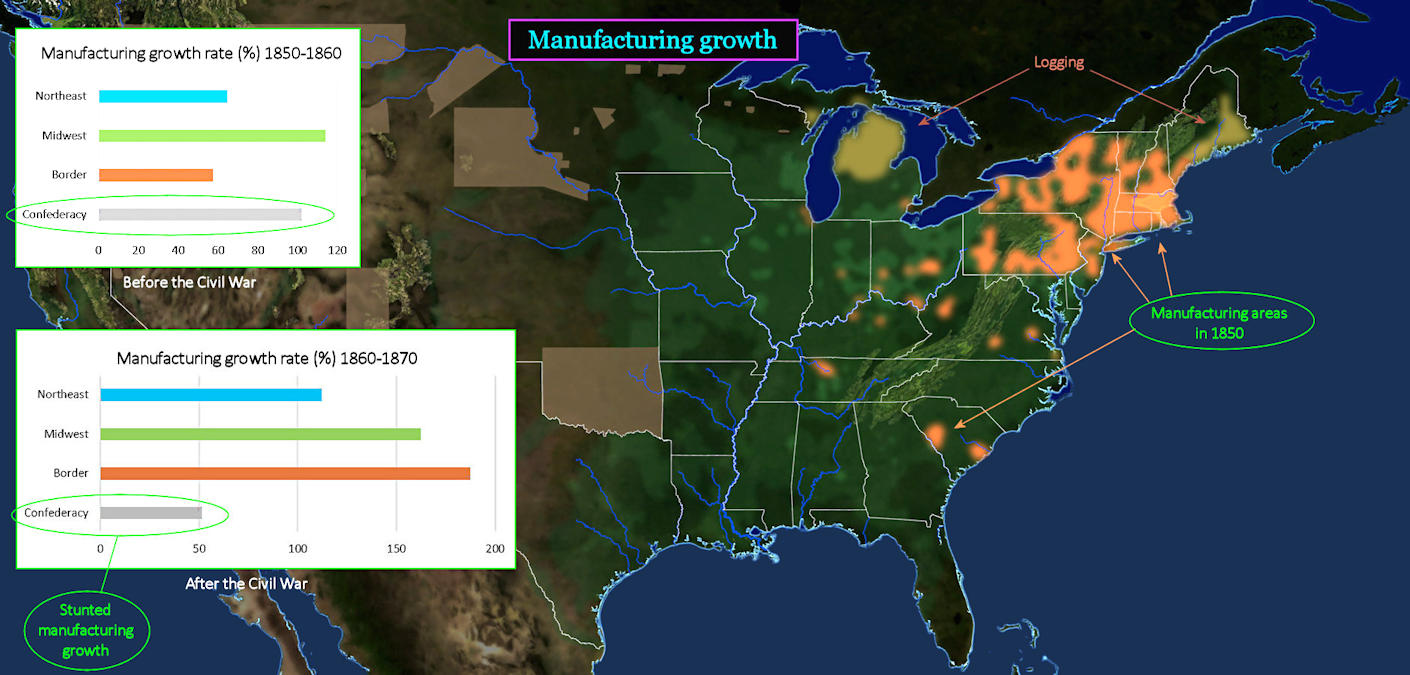
Only in the North These charts compare growth rates for manufacturing activity. Manufacturing growth is largely dependent upon accumulated wealth, because new businesses need large amounts of money to get started. The top chart shows that manufacturing growth in the former Confederate states, before the war, is second only to the Midwest. Activity in the North is growing at barely half this rate. The lower chart shows the growth rate in former Confederate states drops dramatically after the war. The rate is less than half the rate in the North. Manufacturing in the Border states is growing fastest because Missouri, the largest Border state, has the highest growth rate in the country. | |||||||||
| |||||||||
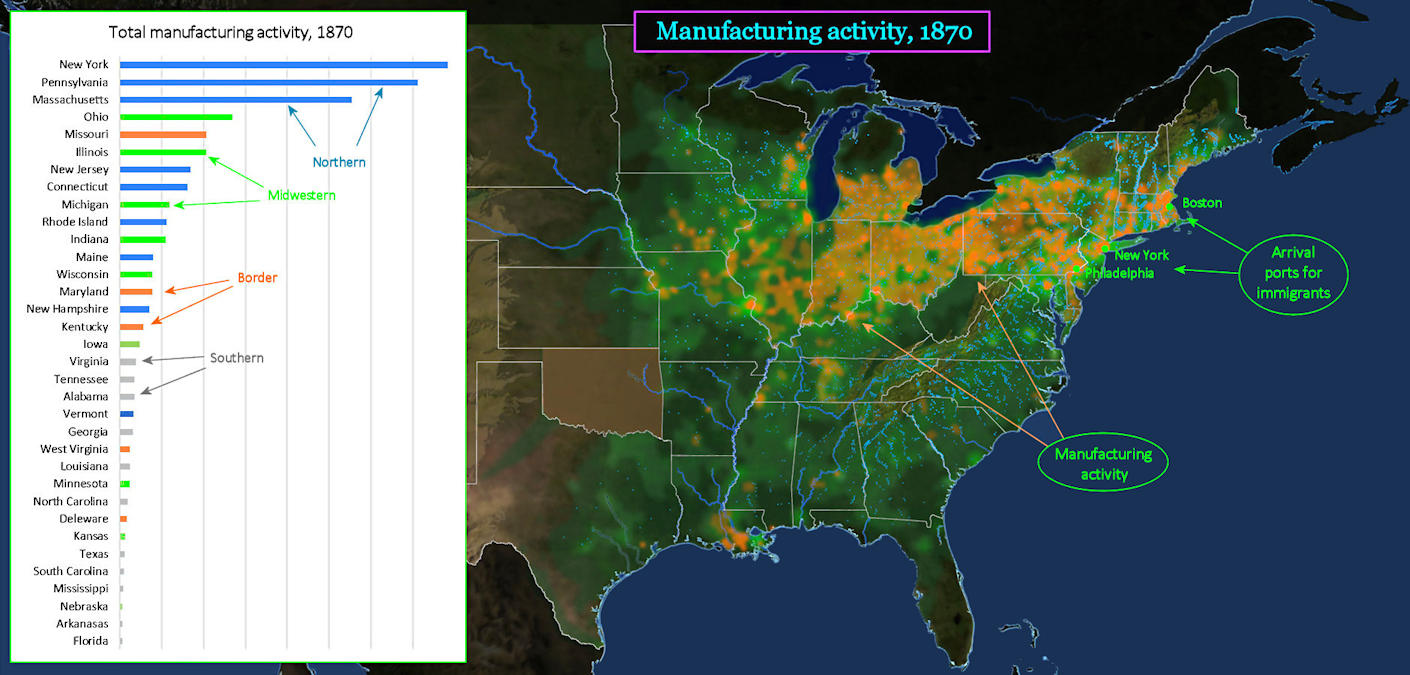
Northeast Enjoys Big Lead This map shows total manufacturing activity in 1870. ORANGE highlights indicate steam-powered factories, while small BLUE dots are water-powered mills. The chart shows that the heavyweights in manufacturing are the well-established northern states of New York, Pennsylvania and Massachusetts. These are the same states where immigrant laborers are arriving in large numbers, at New York, Philadelphia and Boston. The Midwestern states of Ohio, Missouri and Illinois are next on the list, and growing fast. Now look at the South. Compared to the North and Midwest, the former Confederate states are lagging badly. This is partly due to the near total destruction of southern railroads during the war, but also to the loss of wealth. | |||||||||
| |||||||||
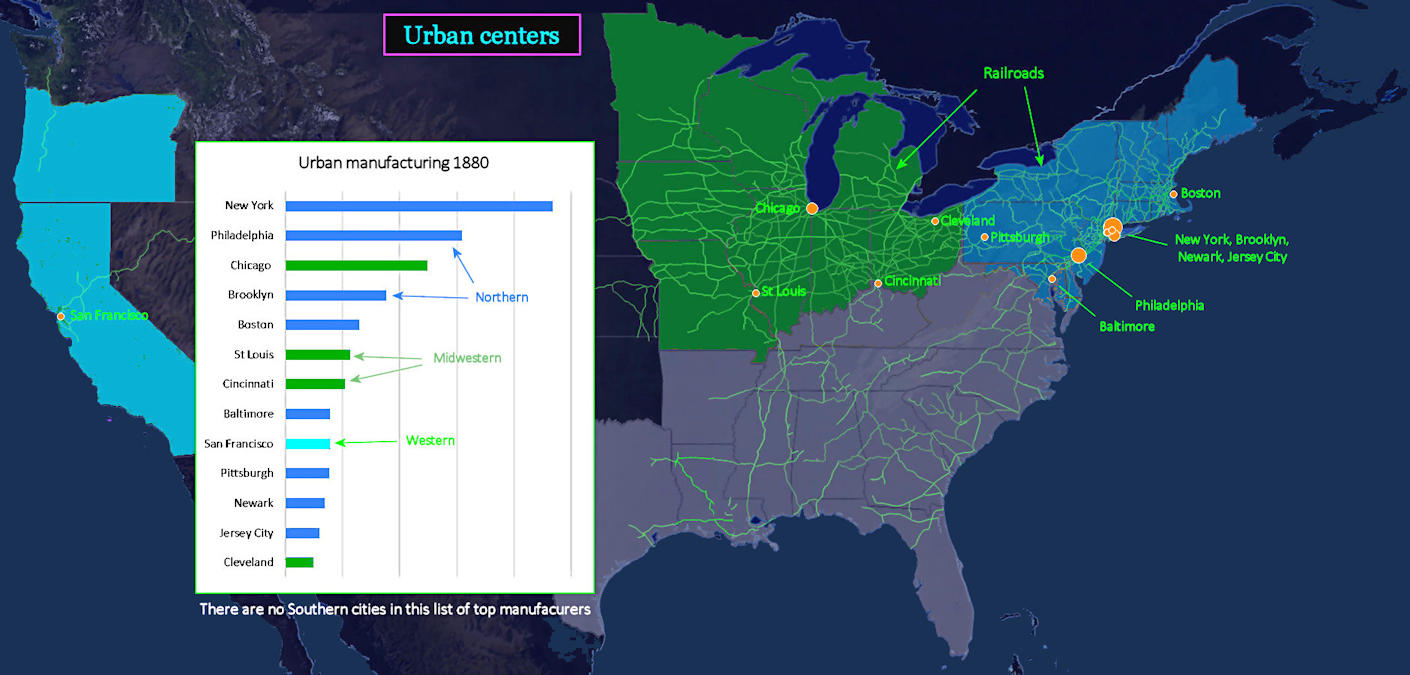
South Left Behind As the industrial boom is taking off, rail-hub cities are acting as gigantic magnets for new industrial activity. The size of ORANGE circles on the map is proportional to the amount of manufacturing activity. Cities with prime locations on the rail transportation network also benefit from easy access to immigrant workers, arriving from eastern port cities. Most workers still walk to work, so factories are located near their workforce, often right downtown. None of these cities are located in the South, which is still trying to recover. New Orleans is growing fairly well, but Richmond never recovers its previous status as the center of southern manufacturing. The region around New York and Brooklyn is the red-hot center of manufacturing. | |||||||||