| |
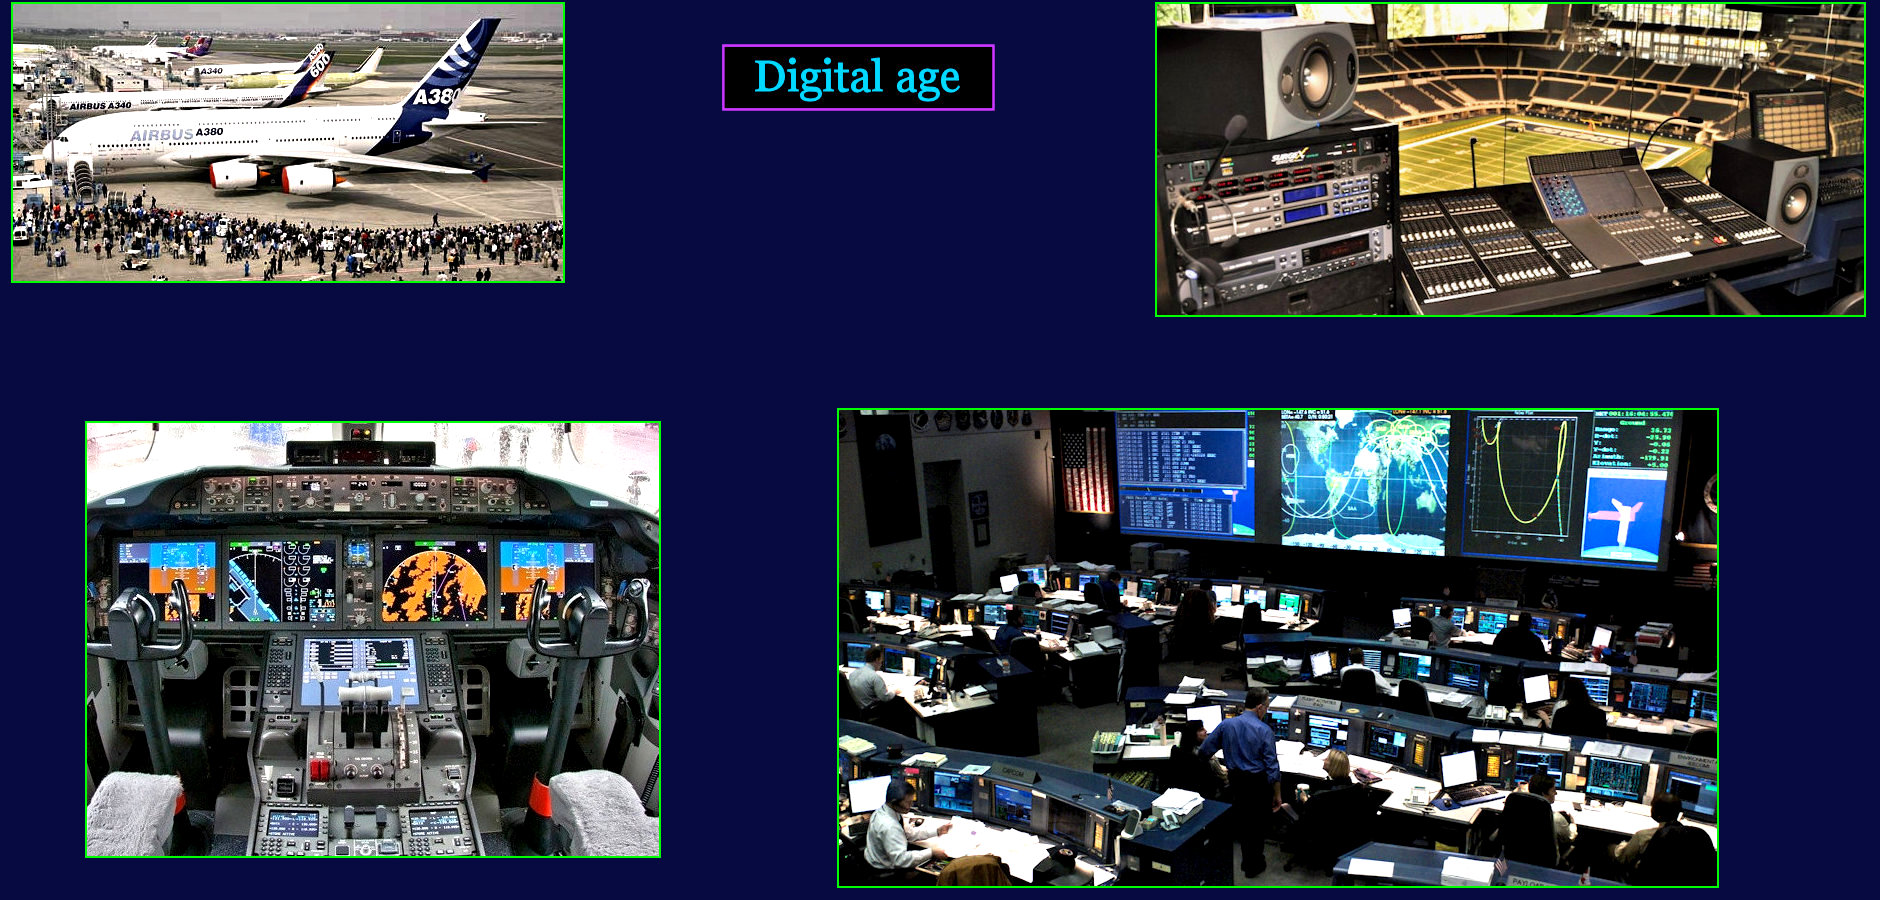
For Your Pleasure By now, we are all familiar with the benefits of the digital age. This entire presentation, in fact, would be impossible without the internet and graphical editing software. |
| |||||||||
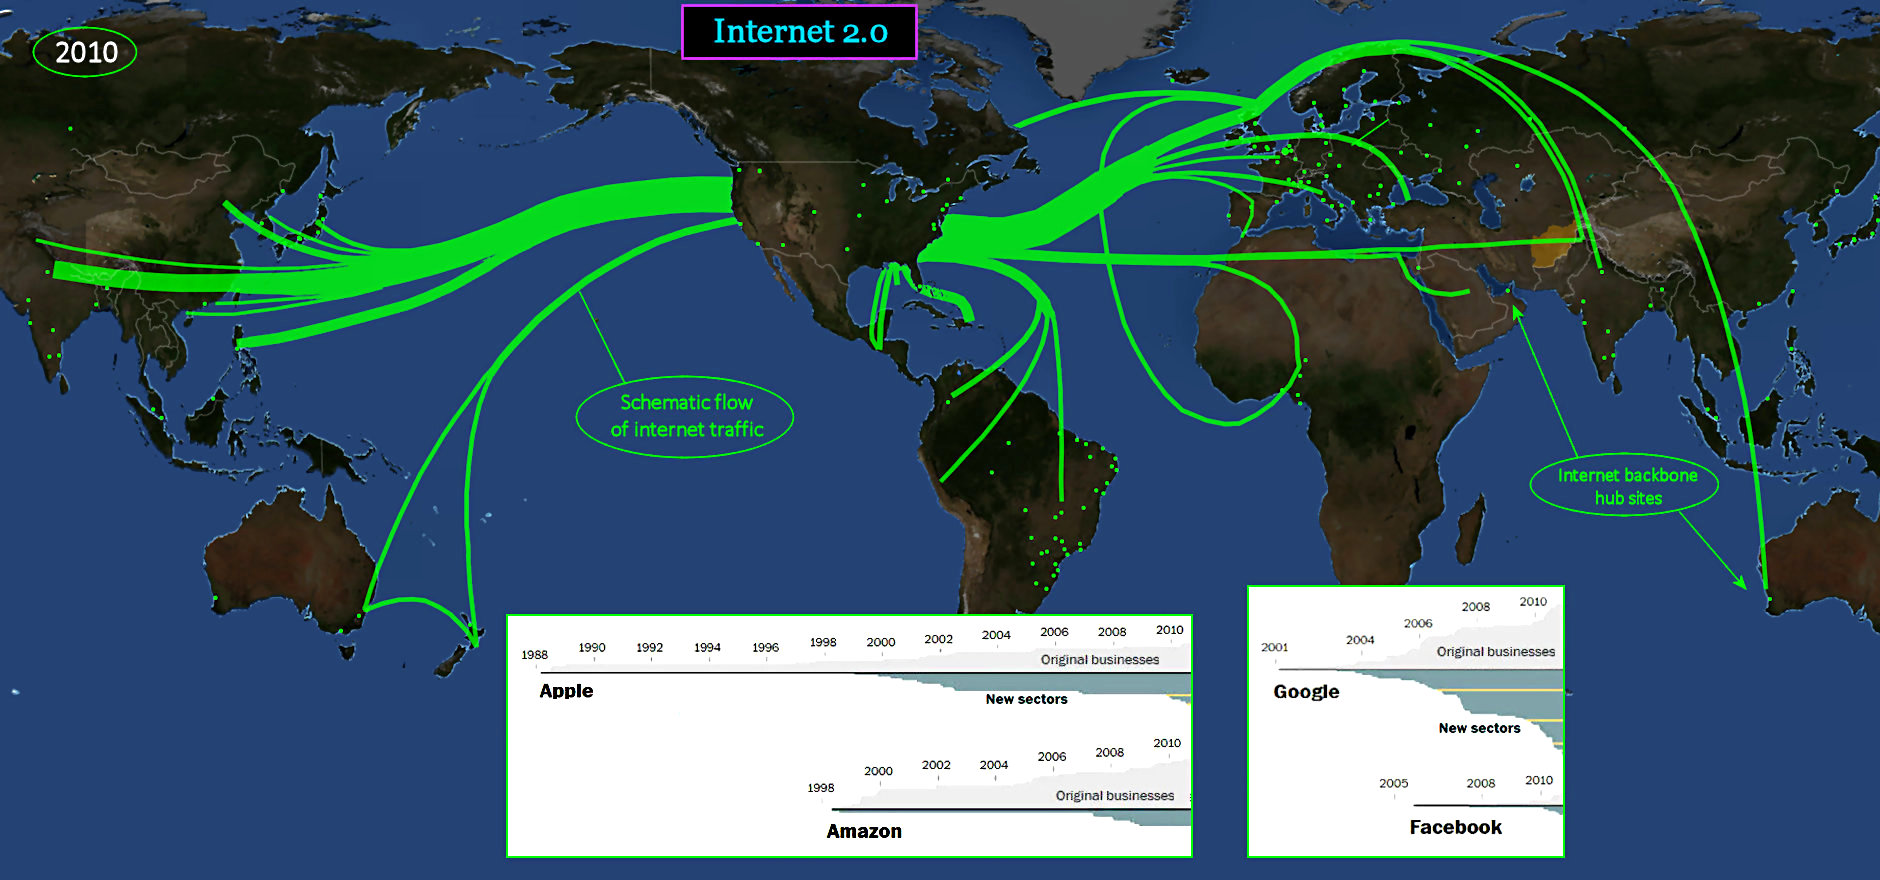
Fully Mature By 2010, the internet is standard everywhere on the planet, except the darkest corners of the Global South. The charts above track the development of the most powerful internet companies, showing how each one starts with a small core business, but then acquires a string of smaller startup companies (in GRAY-GREEN). These additions allow them to acquire the talent of the most innovative new developers, enabling growth into new market sectors. Each company continues to gobble up promising technology. | |||||||||
| |||||||||
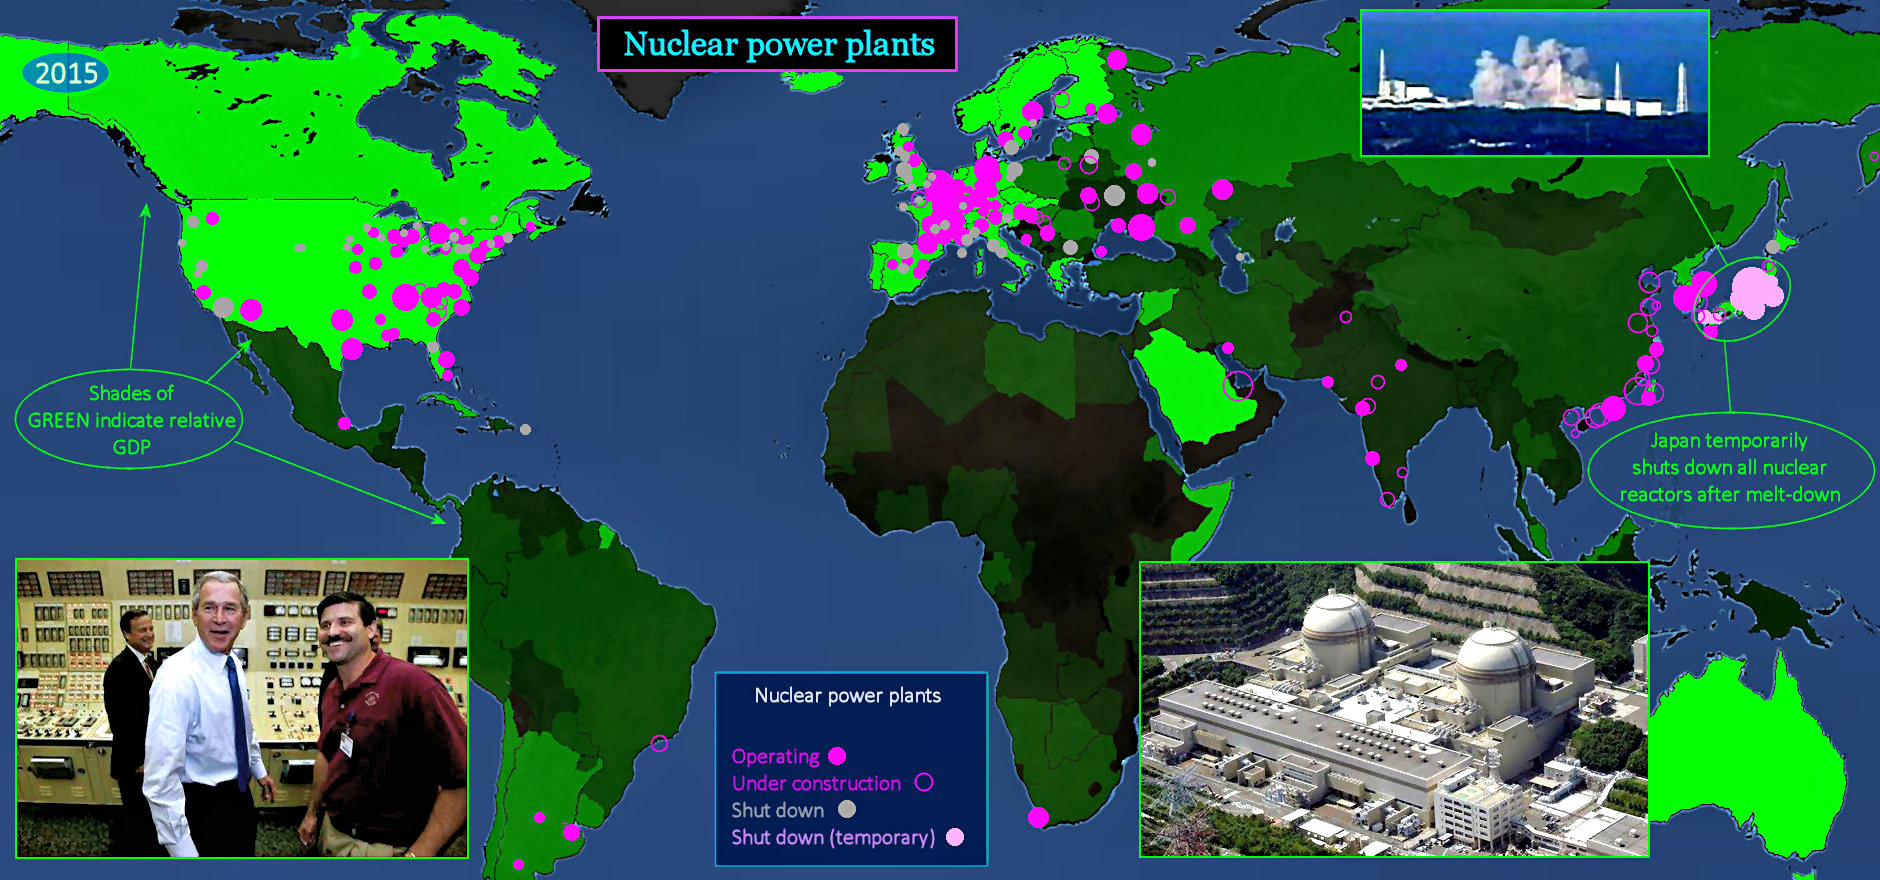
Spreading the Load This map shows that many countries have built nuclear plants to produce electricity, thus reducing reliance on expensive imported oil. Plants shown in GRAY have been shut down, due to concerns about nuclear accidents, and the disposal of spent nuclear fuel. The large number of plants in the US reflects the fact that the US is still a net importer of oil. Central Europe, with little oil and gas, has many nuclear plants. Most plants under construction are located in China and India. | |||||||||