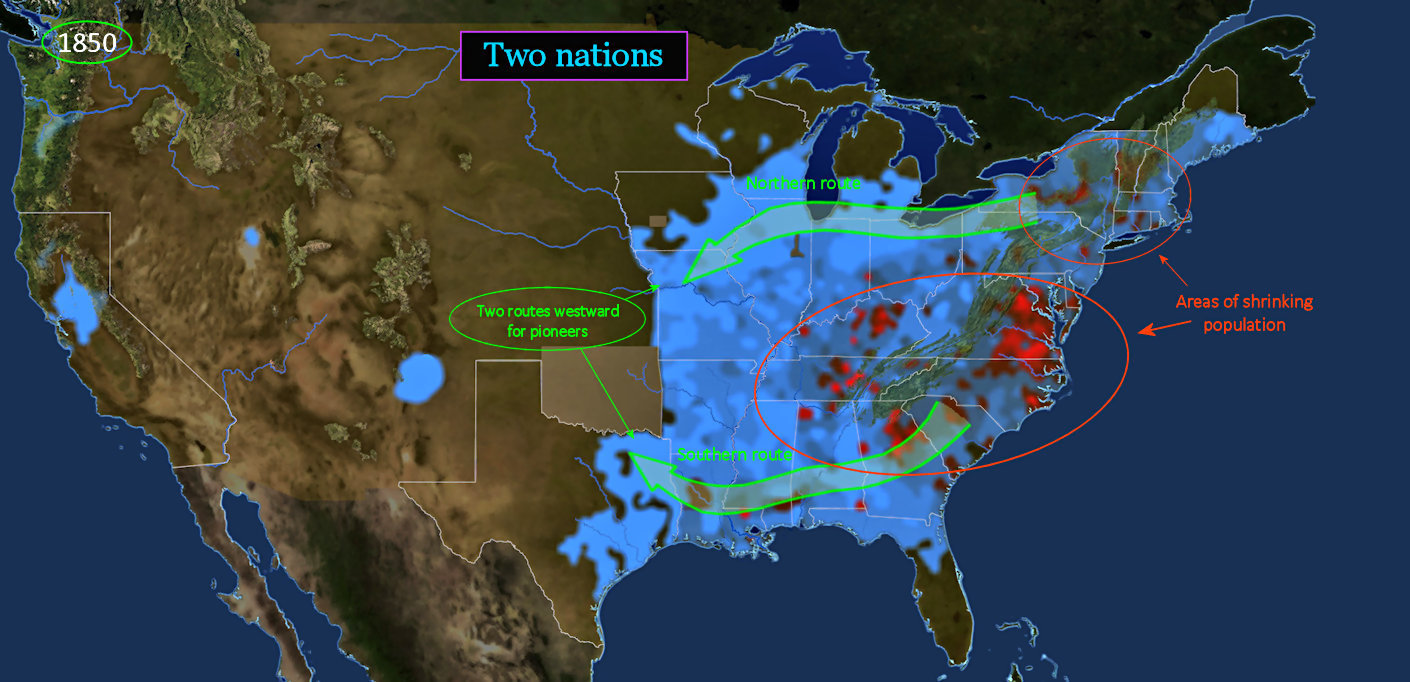
Separate RegionsThe separate routes are symptomatic of the almost total split that is opening between North and South. In fact, America has been divided since the very beginning, as Northerners and Southerners have never really mixed. In the South, the entire economy is based on the plantation. The crop changes over time, but the plantation method remains constant, and with it, the total dependence upon a large slave labor force. In the North, by contrast, the economy has been continually shifting. Shipping, fishing and lumbering were important in the early years, but manufacturing and railroads are the big new things. |
| ||||||||||||||||
| |||||||||
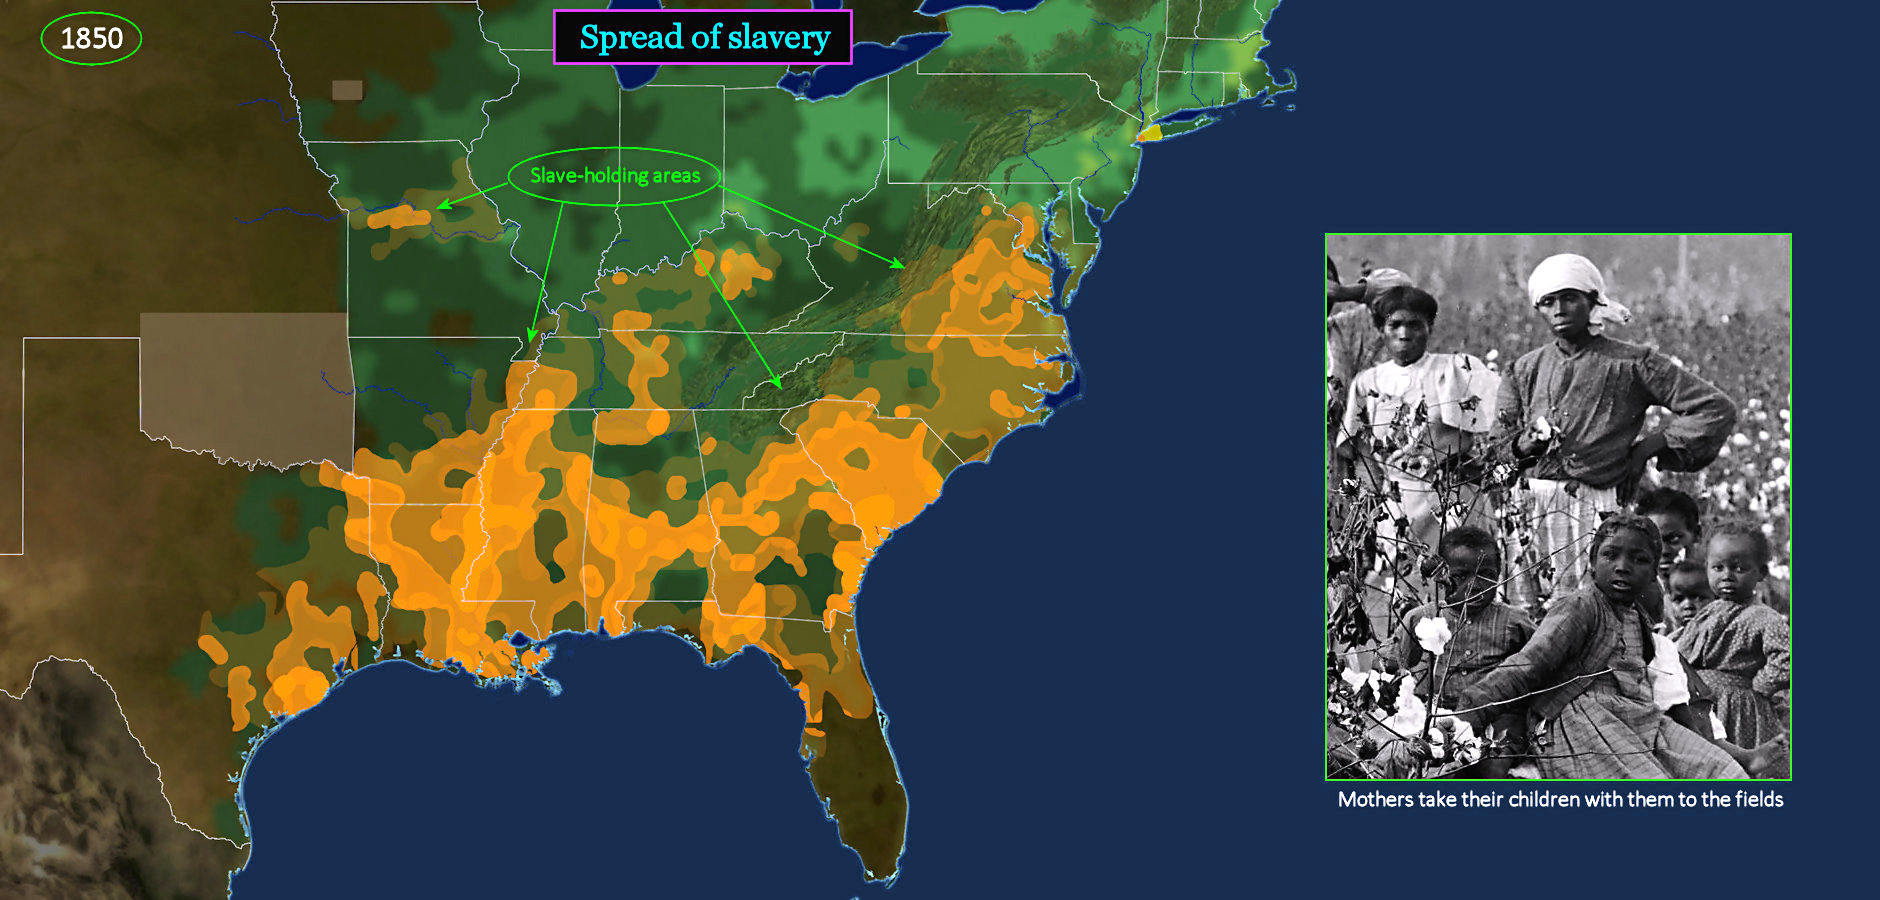
Cotton-belt Slavery Previous to 1800, the institution of slavery had been slowly withering away in the South, as the profitability of tobacco plantations declined. Some Southerners even began to accept the possibility that slavery might eventually disappear altogether in America. Planters continued to abandon tobacco country for opportunities further west. The arrival of the cotton gin in 1800 suddenly changes all that. Almost overnight, cotton plantations are producing healthy profits, which continue to grow in response to increasing demand for cotton by textile mills in Britain and New England. As a consequence, slaves are again in high demand. The areas highlighted in ORANGE above indicate the extent of slavery by 1850. The brighter the ORANGE, the greater the density of slaves. | |||||||||
| |||||||||
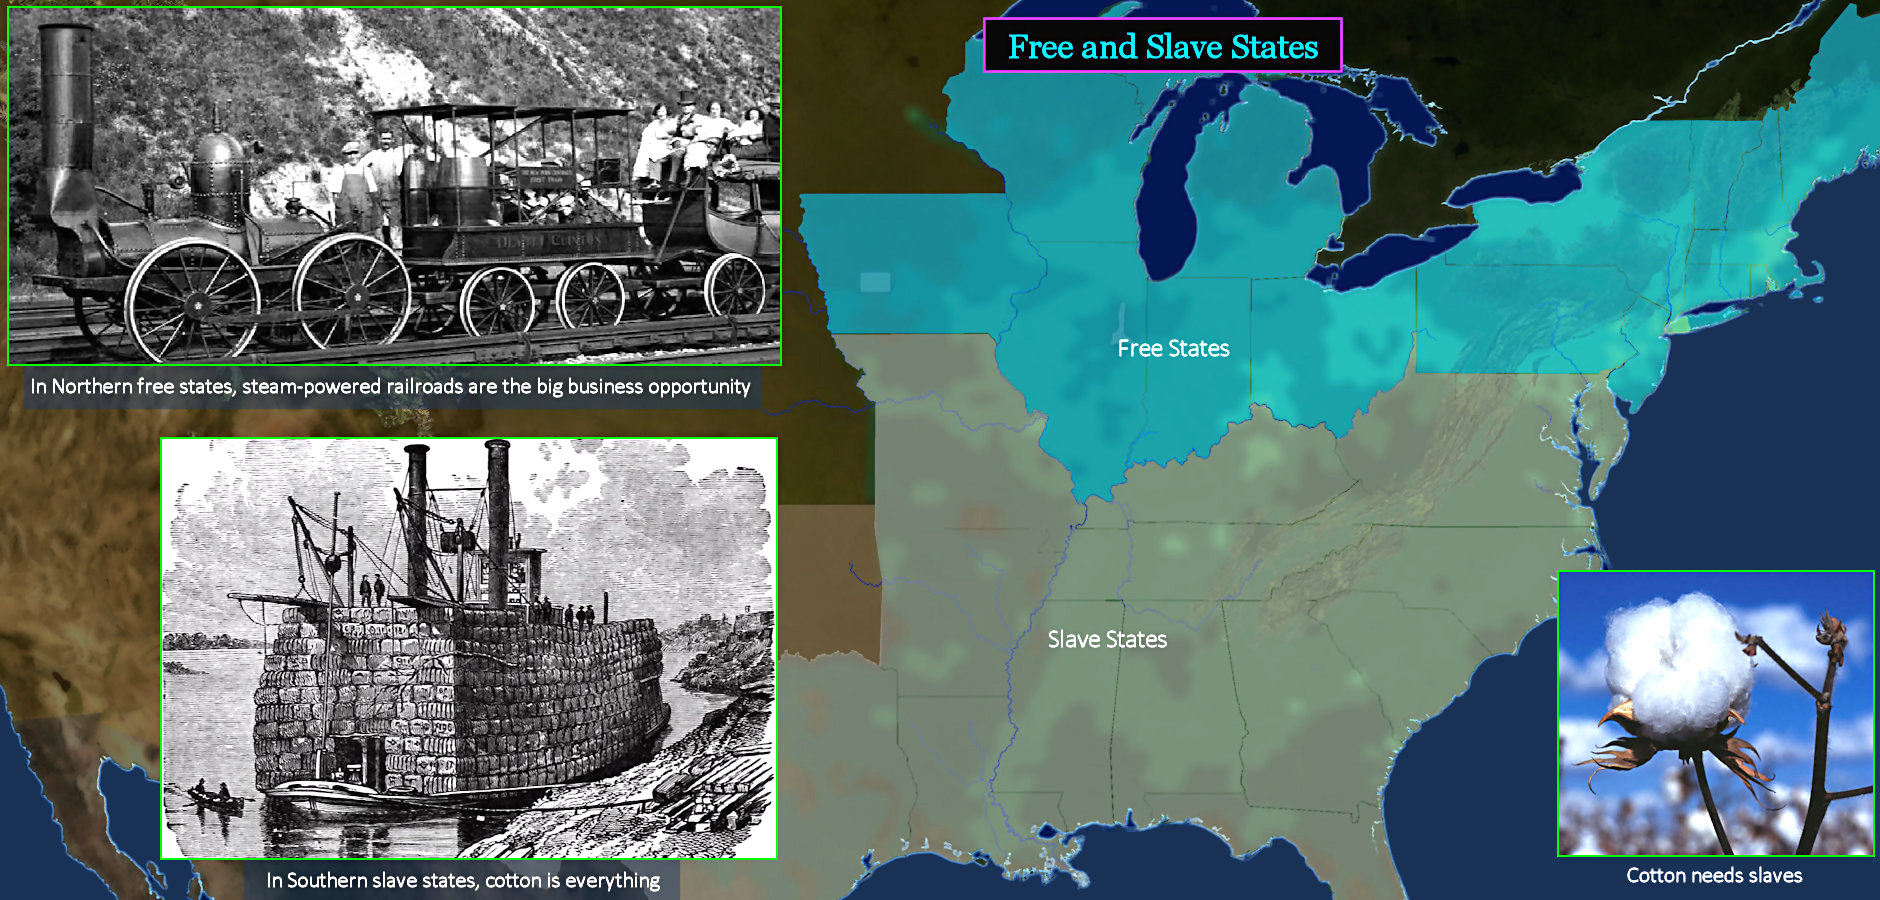
Blue and Grey By 1850, the country is deeply divided over slavery. Southerners simply can't maintain plantation life without large numbers of slaves, whose numbers keep increasing due to births to slave mothers. Southerners want very little from Congress, other than to keep discussion of the slavery issue off-limits. Northern states are in a completely different situation. Crops are important, but business is becoming increasingly dependent upon steam-powered machinery. Even so, northern manufacturers are still learning the ropes. What they need from Congress is protection from foreign imports. For years, the uneasy balance in Congress between free and slave states has been maintained, but this is slowly and surely changing in favor of the North. | |||||||||
| |||||||||
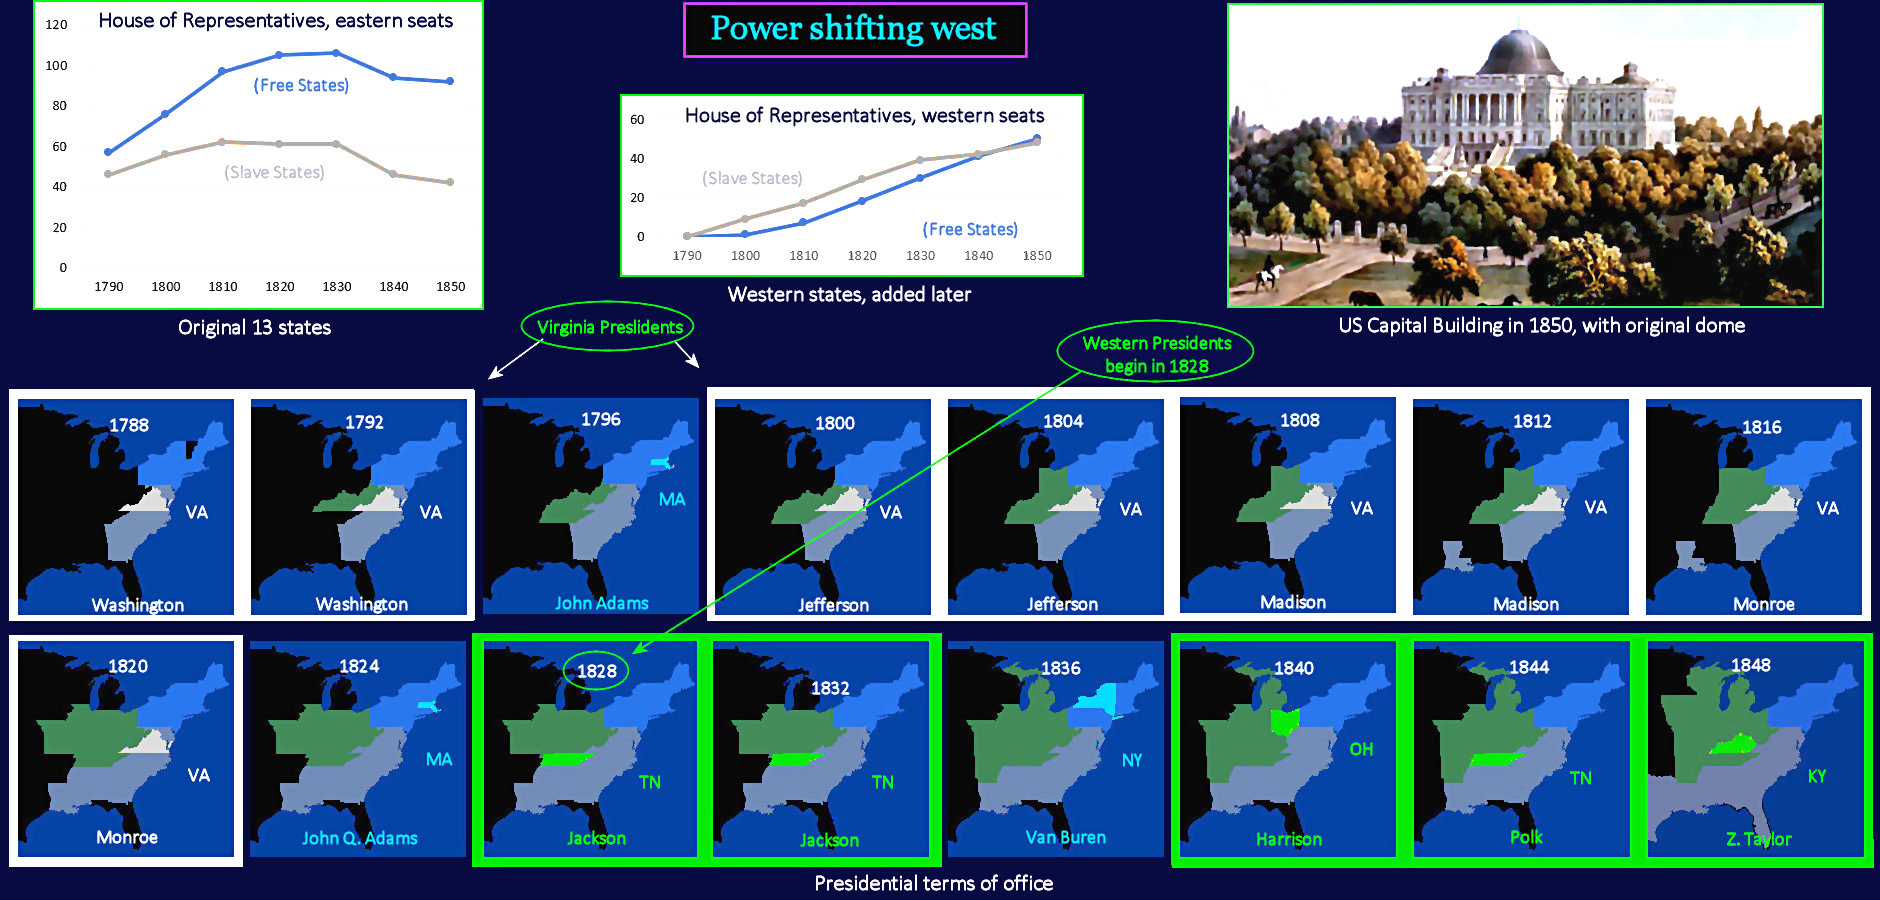
Growing Western Power When America's first election is held, the number of seats in the House of Representatives for free and slave states is almost equal (chart, top left). But northern states add population much faster than southern states, and have twice as many seats in these original states by 1850. The second chart shows House seats in newly-added western states. In this group, the free and slave states remain nearly balanced until 1850. The bottom half of the screen shows the home state of every President elected prior to 1850. For the first 30 years, almost all are from Virginia (WHITE-bordered boxes). But beginning with Andrew Jackson in 1828, almost all new Presidents are coming from western states (GREEN-bordered boxes). | |||||||||
| |||||||||
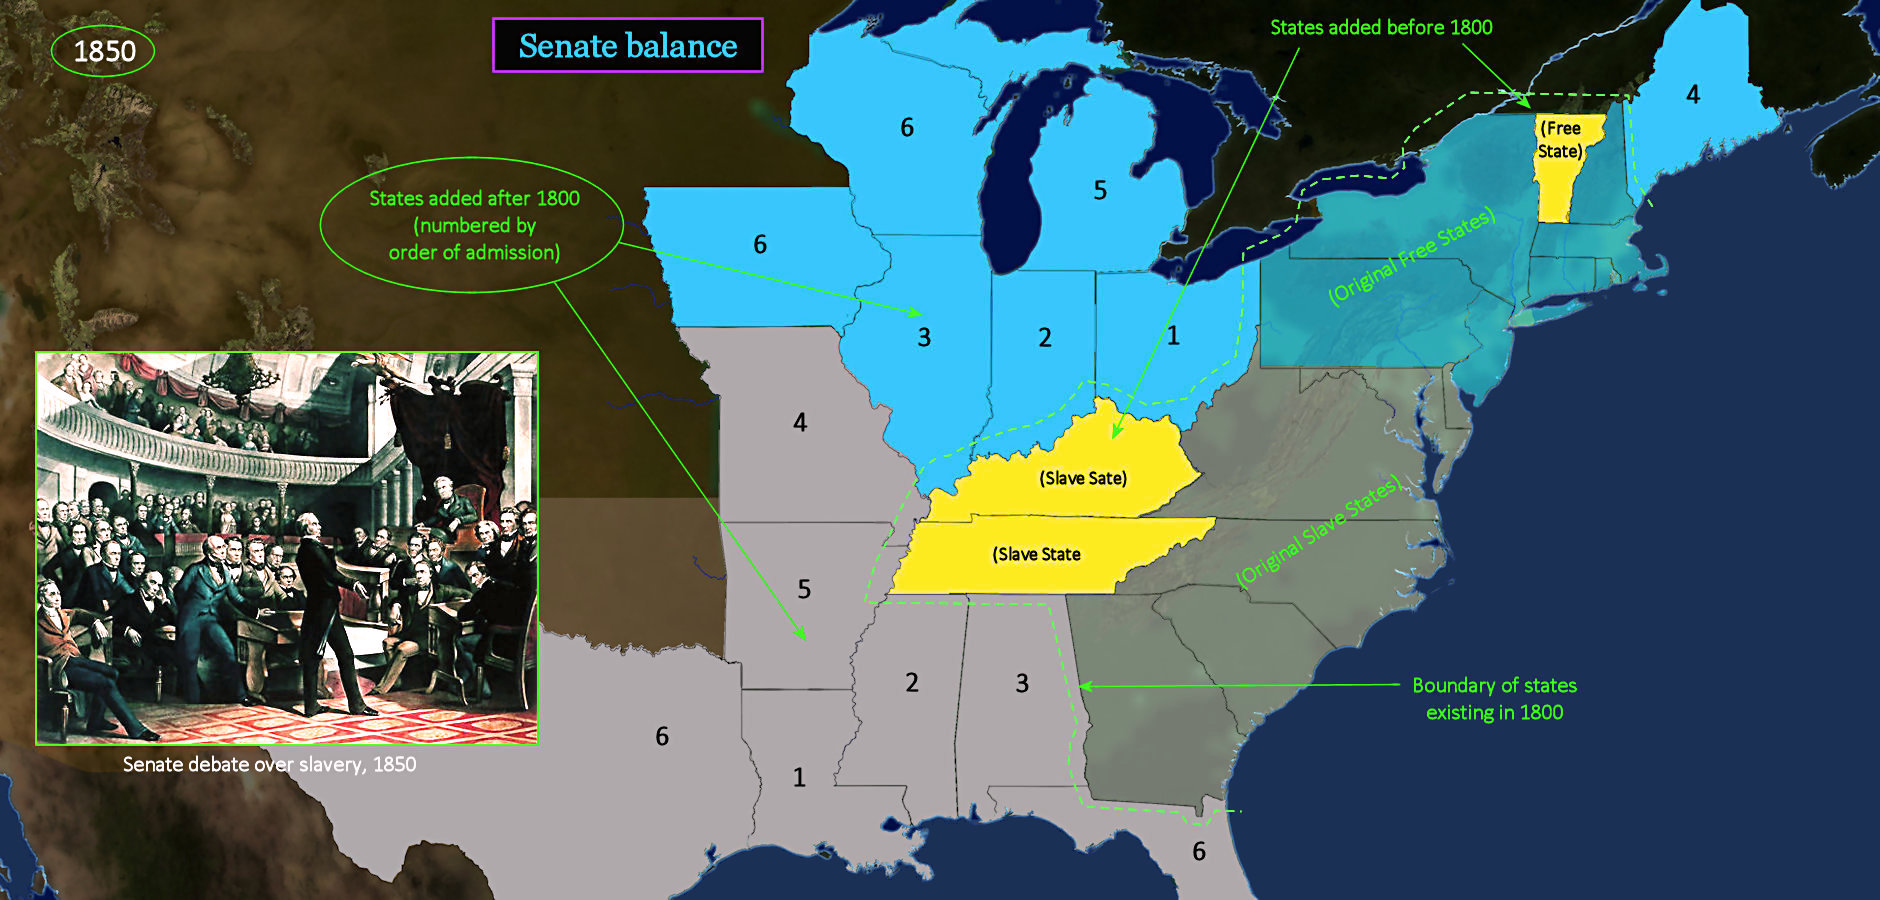
Maintaining Balance While southern power is shrinking in the House of Representative, the slave states depend upon the Senate to protect their slave-holding interests. In the Senate, each state gets two votes, regardless of population. The three states shown in YELLOW are added very soon after the first national election. This brings the numbers to balance, with 8 free states and 8 slave states. From then on, states are added roughly in pairs, so that each new free state (BLUE) is balanced by a new slave state (GRAY). States on the map with the same number were admitted at nearly the same time. By 1850, there are 15 free states, and 15 slave states. Senate debates from this period (top left) are considered some of the most eloquent and impassioned ever witnessed. | |||||||||
| |||||||||
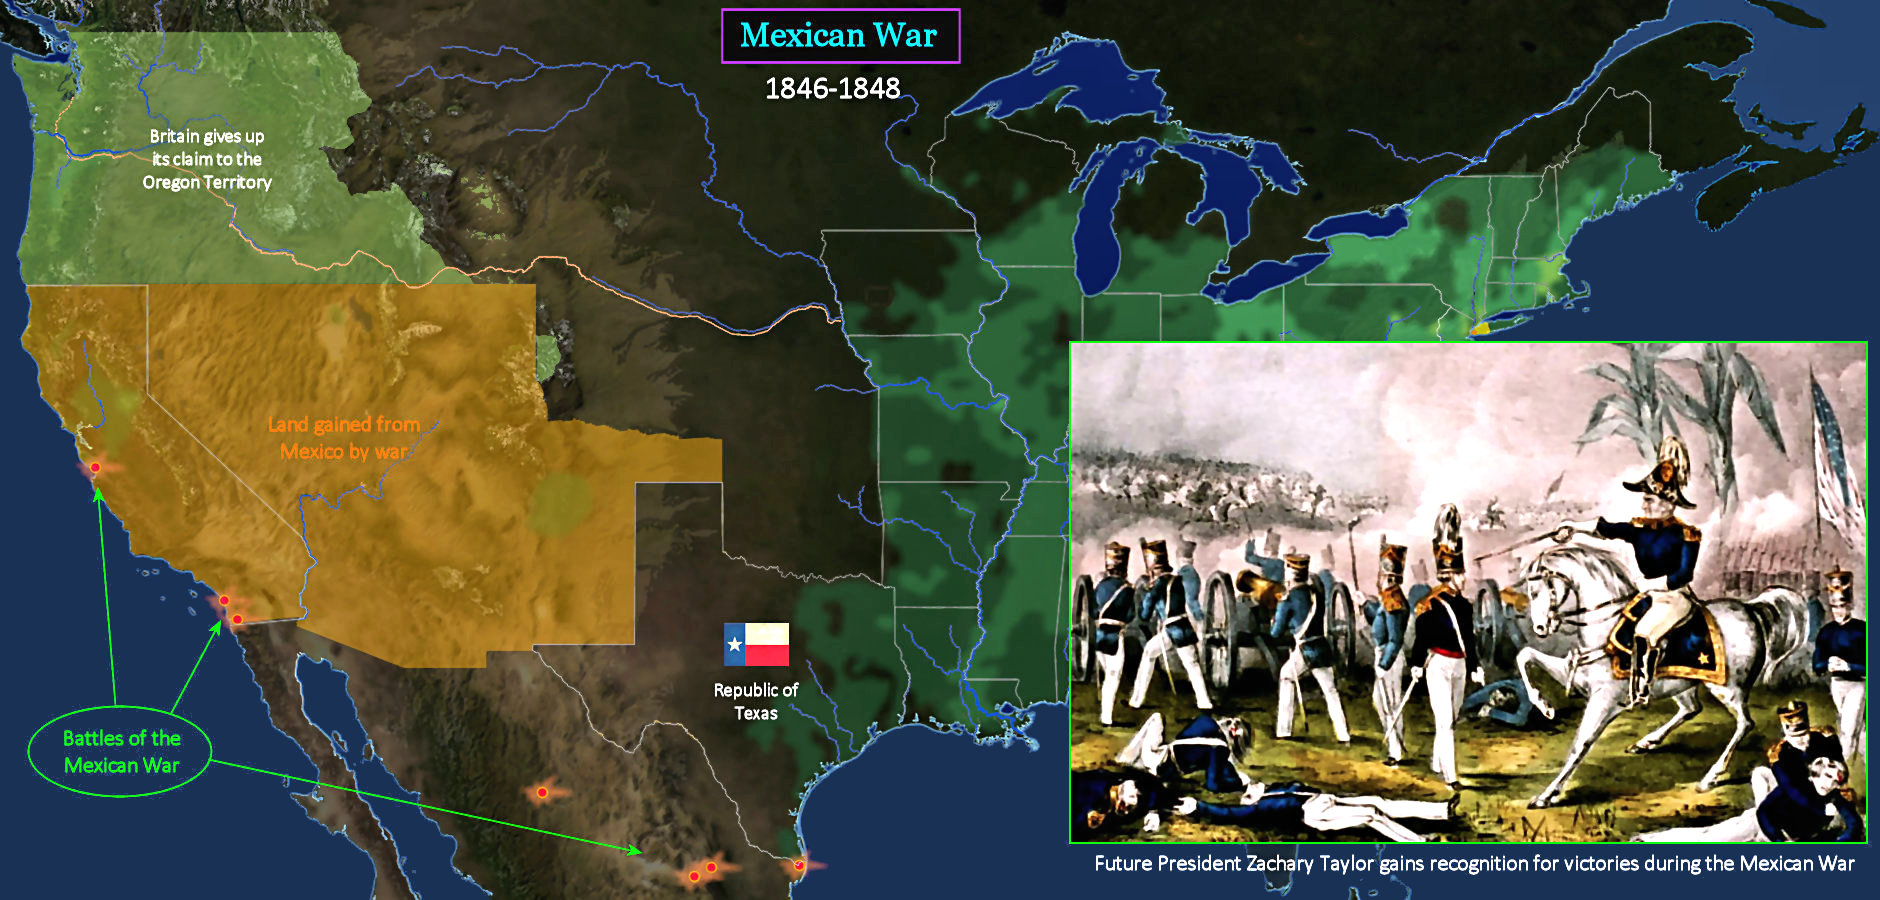
Southwestern Expansion Shortly after the briefly independent Republic of Texas is annexed by America, hostilities with Mexico come to a boil. Mexicans still consider Texas to be part of Mexico, and send troops into the disputed territory. America responds by invading Mexico itself, hoping to acquire all Mexican territory stretching to the Pacific Ocean (ORANGE highlight). Gold has not yet been discovered in California, but most American's believe in a God-given destiny to extend from ocean to ocean. In any case, almost no one actually lives in the Desert Southwest, and Mexico has no realistic prospect of developing this territory. After a two-year war fought entirely within Mexican territory, the Mexican capital falls to the Americans, and Mexico is forced to cede the entire territory, in 1848. | |||||||||