
| |
The Sky's the Limit Charles Lindbergh makes his historic trans-Atlantic flight in 1927, just two years before the crash. In the same year, Babe Ruth sets a long-time major-league record for home runs. Corporate managers all over America are finalizing plans to erect giant memorials to the good times in the form of towering office buildings, smack downtown. |
| |||||||||
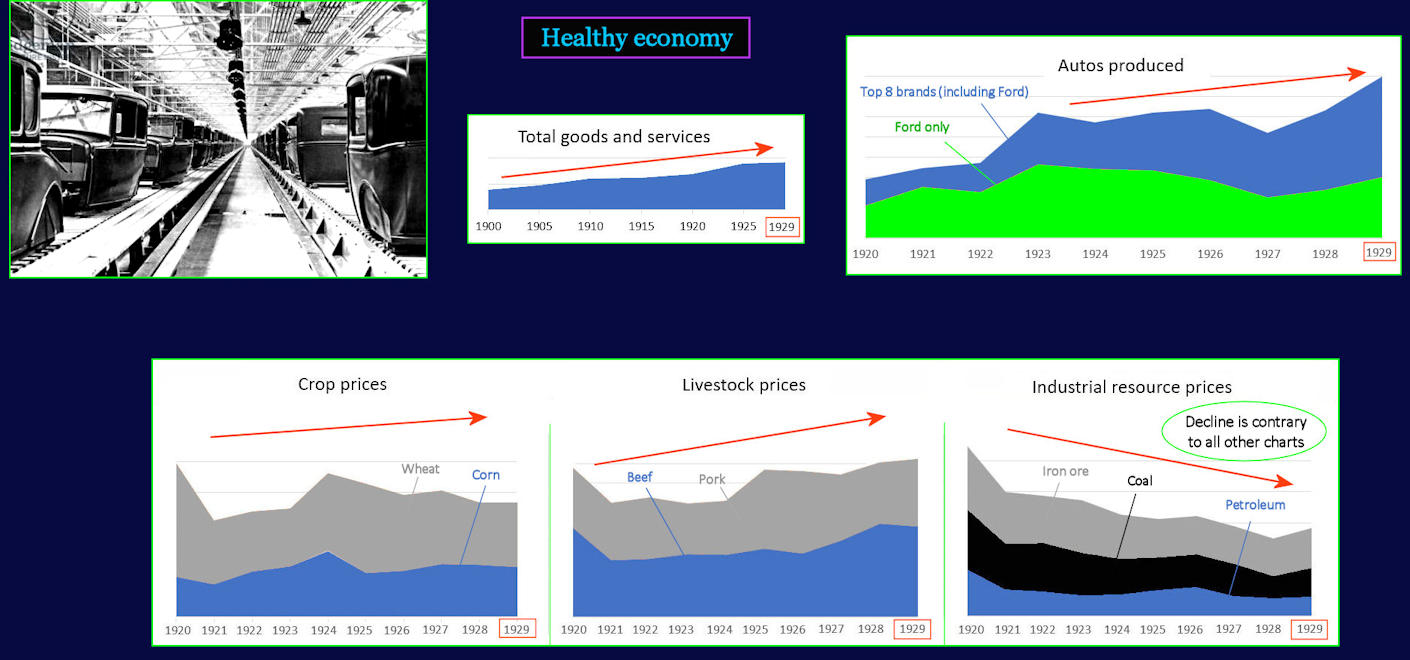
All Good, Except Iron The small chart (center top) shows a 30-year stretch of steady economic growth, with barely a bump. Auto production continues to rise, as increasingly popular General Motors brands kept eating into Ford's share (top right). Auto sales hit a new high going into the year of the crash. The set of charts across the bottom tells a somewhat different story. The prices of farm products are rising (two left-most charts), but prices for industrial resources are steadily dropping (right-most chart). | |||||||||
| |||||||||
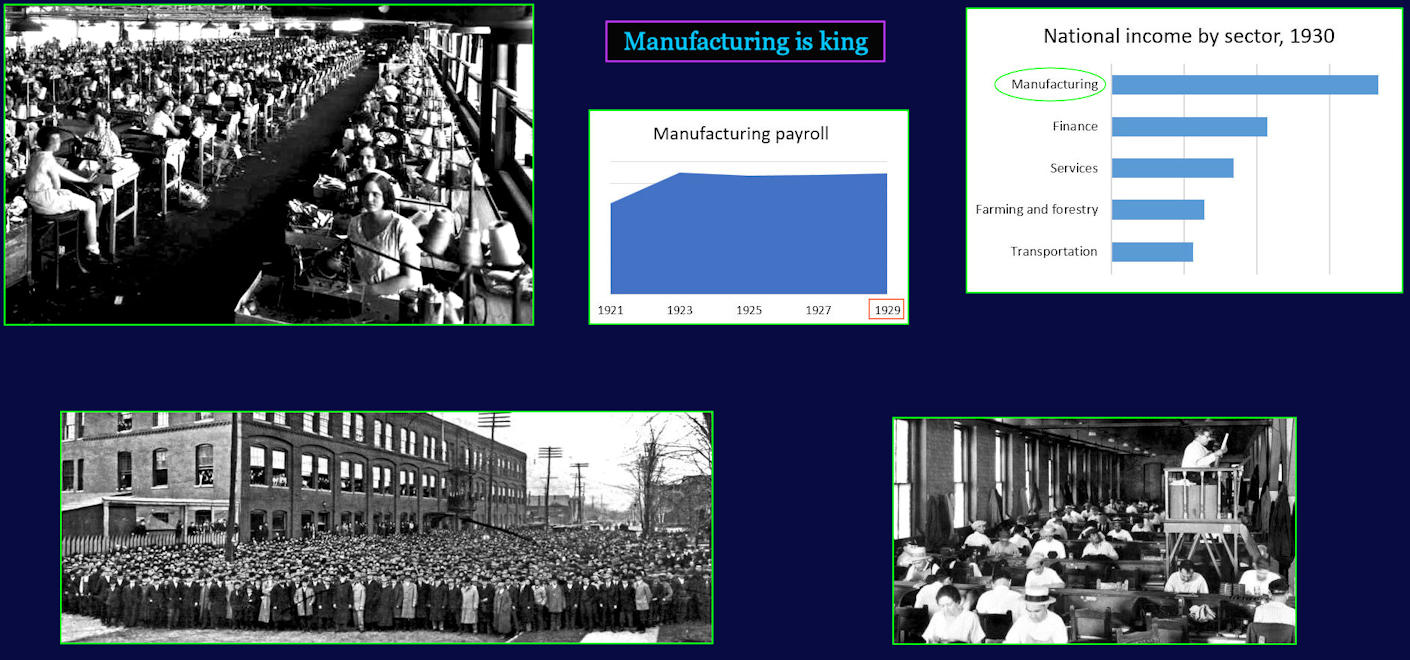
Bigger, More Efficient Factories of all kinds are growing in size (top and bottom left), producing higher profits. This is largely due to improved machinery, and an increased focus on efficiency. The smaller chart (center top) shows steady manufacturing payroll (total wages), which is a better measure of economic conditions than the actual number of jobs. That's because wage cuts reduce family income, even when workers are not losing jobs. Manufacturing remains America's strongest sector (top right). | |||||||||